
Outside of the bubble, AI is Black Mirror
A reality check on AI enthusiasm: how a simple chart generated vitriolic reactions outside the tech bubble.
Get new posts by email
Subscribe via RSSA reality check on AI enthusiasm: how a simple chart generated vitriolic reactions outside the tech bubble.
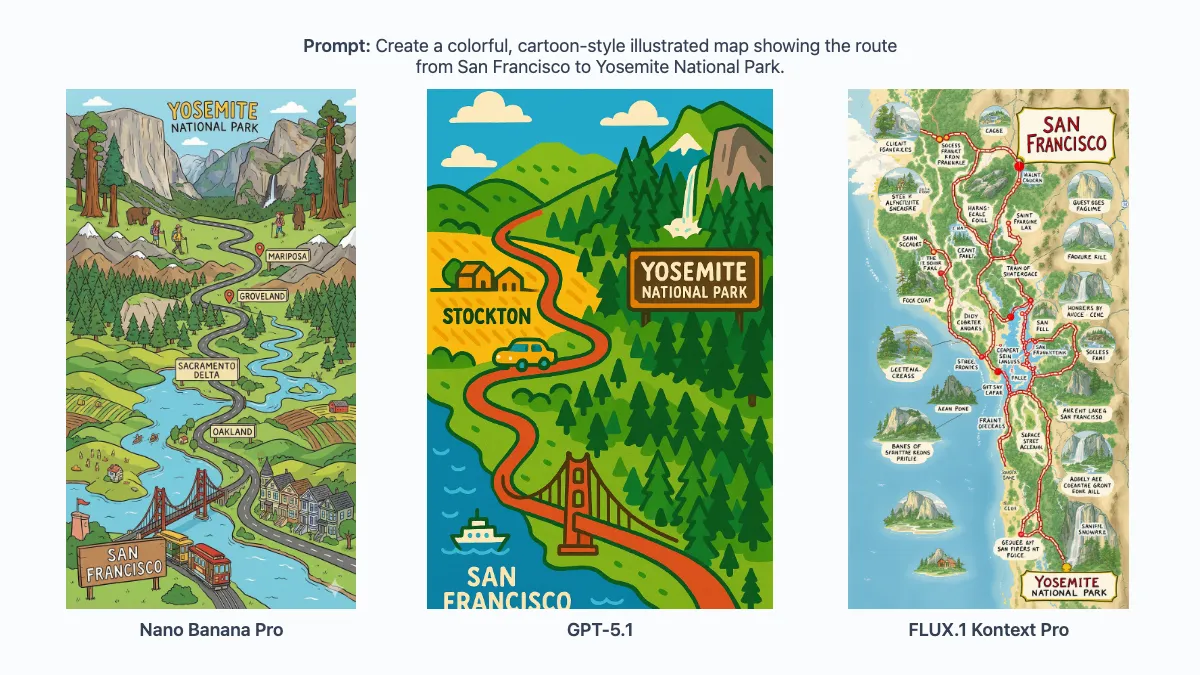
Finally, an AI that can draw a map or create an infographic. The capability of leveraging tools pushed the frontier of image generation.
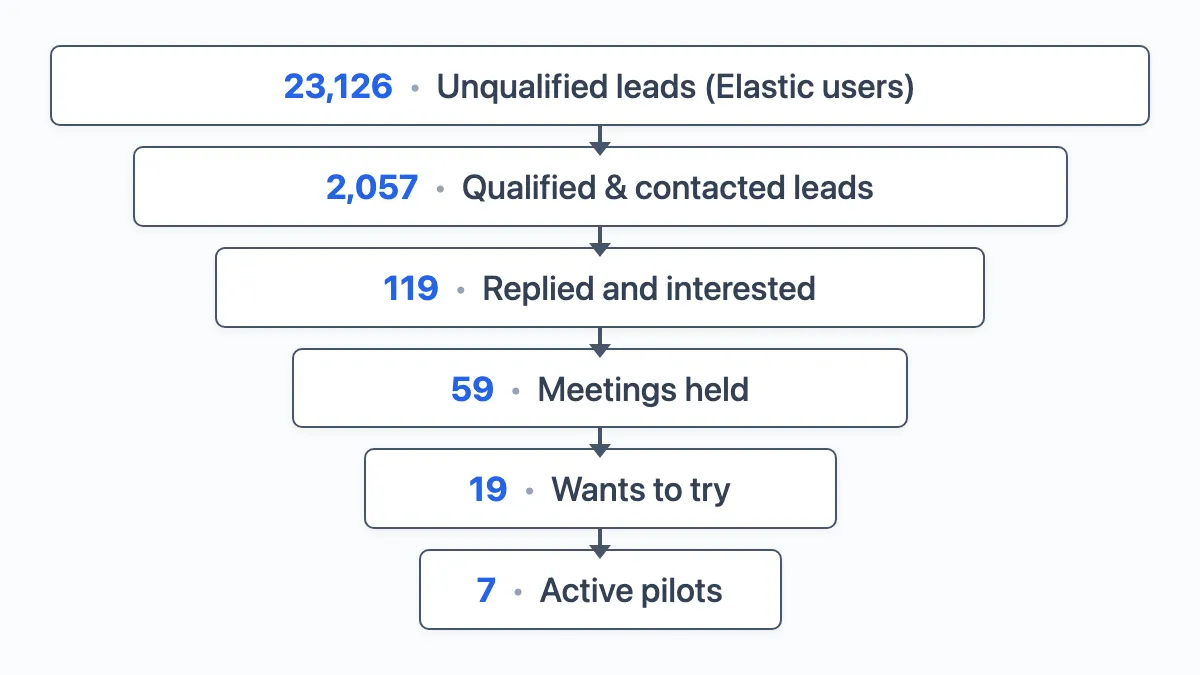
We had a great team, $2.5 million, and a validated problem. A year later, we sold our IP for parts. Here’s what we learned about urgency and co-foundership.
 HN
Local LLMs prioritize privacy over security. Our research reveals a 95% backdoor injection success rate.
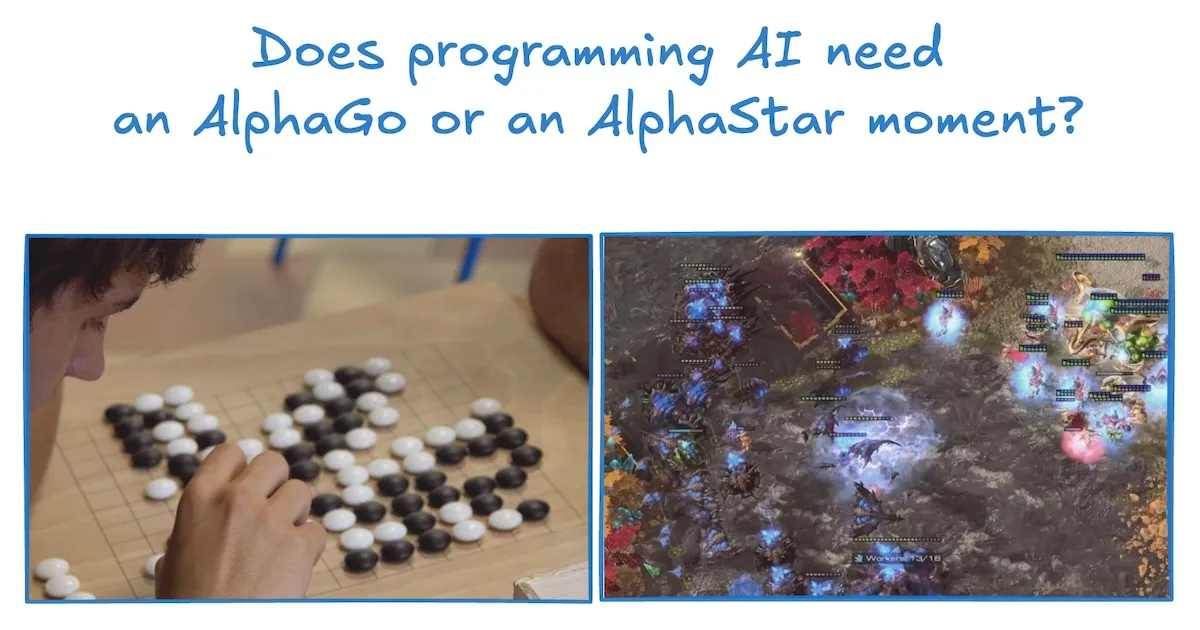
AI excels at clean algorithms but fails at messy, real-world codebases. The solution lies not in Go-like intelligence, but StarCraft-like complexity.
 HN
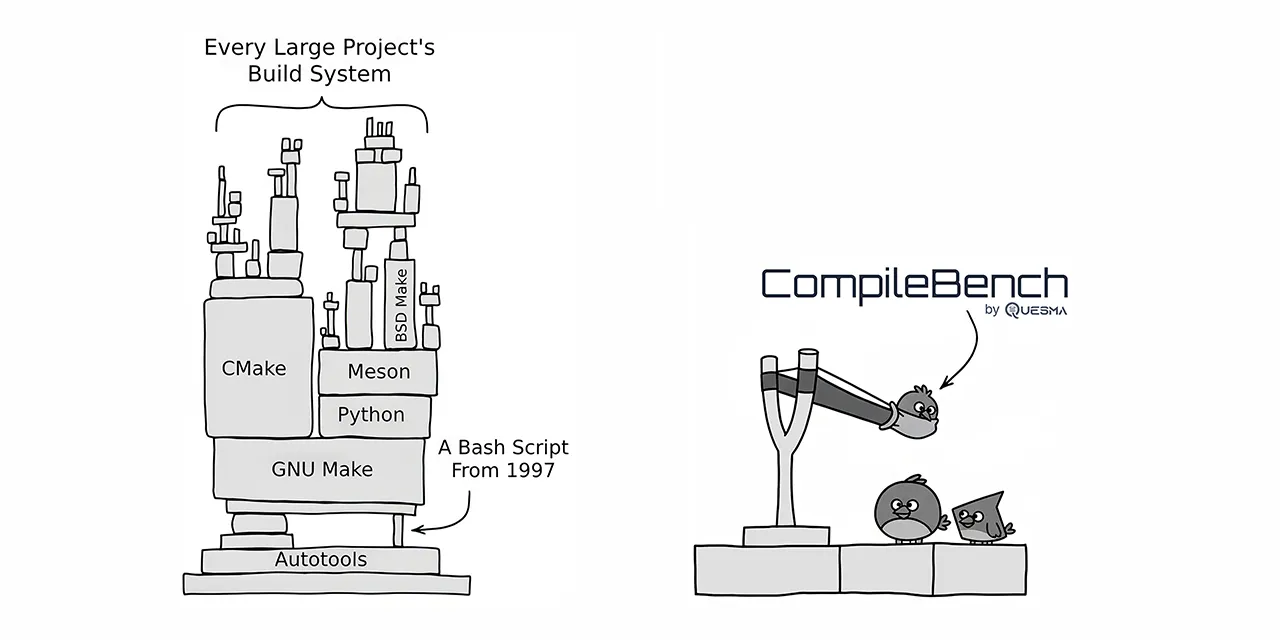
We tested 19 LLMs on their ability to handle real-world software engineering tasks like compiling old code and cross-compiling. See how Anthropic, OpenAI, and Google models stack up in our new benchmark – CompileBench.
 HN
We expected small models to be fast, but our benchmarks revealed a common reliability trap. Here’s our deep dive on finding and fixing it.
 Featured
A one-line command to diagnose server health. Uses Nix to fetch tools without sudo and an LLM to summarize the output. No installation required.
Deep dive into the Tau² benchmark that goes beyond LLM evaluation to reveal innovative methodologies for testing AI agentic systems in realistic scenarios. Learn how this framework can transform how we test AI-powered software.
Learn how Go practitioners ship telemetry in 2025 – what works, what hurts, and the tools, workflows, and guardrails they rely on for metrics, traces, and logs.
Why we moved our AI chart generator from in-browser WebR (WASM) to AWS Lambda. A case study on the real-world trade-offs of running AI-generated R and ggplot2 code.
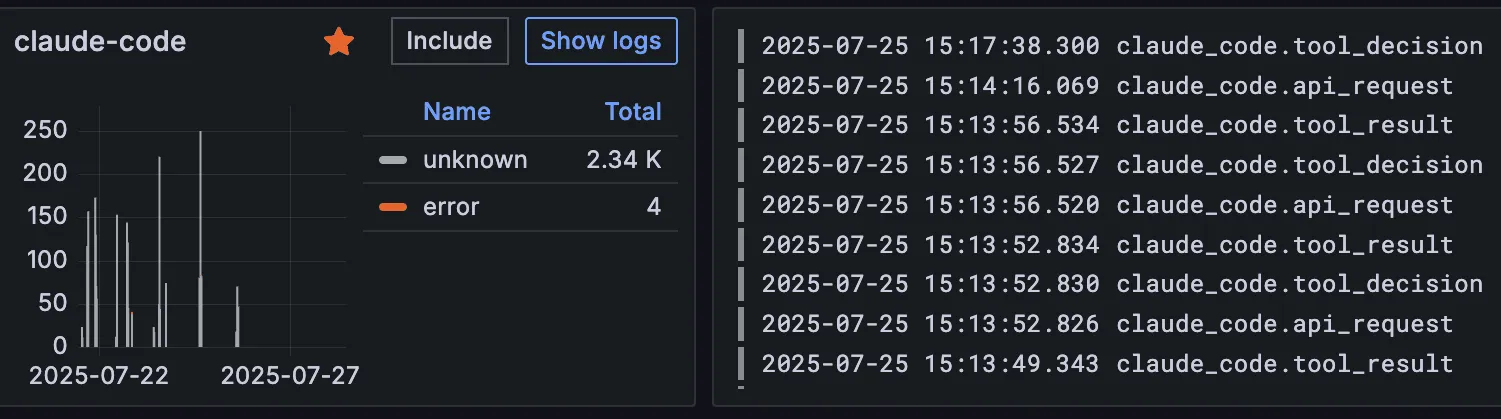
Learn to monitor Claude Code costs, tokens, and latency in 5 minutes using its native OpenTelemetry support with Grafana Cloud.
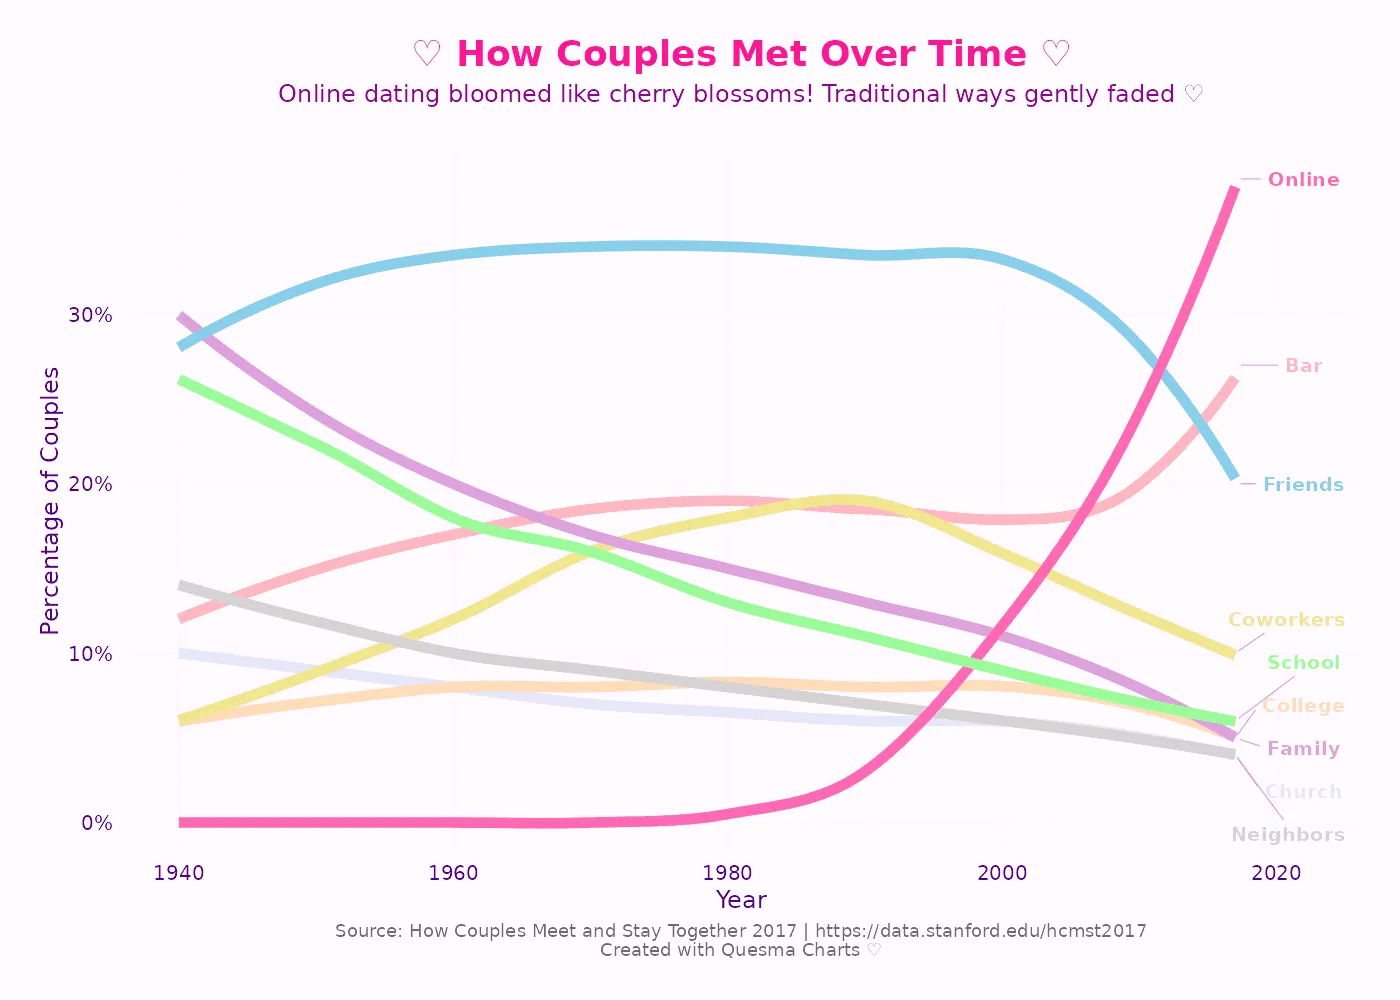
Same dating data, 5 different charts: do you prefer the academic journal, The Economist, a Redditor’s take, or creating your own with AI?
 Featured
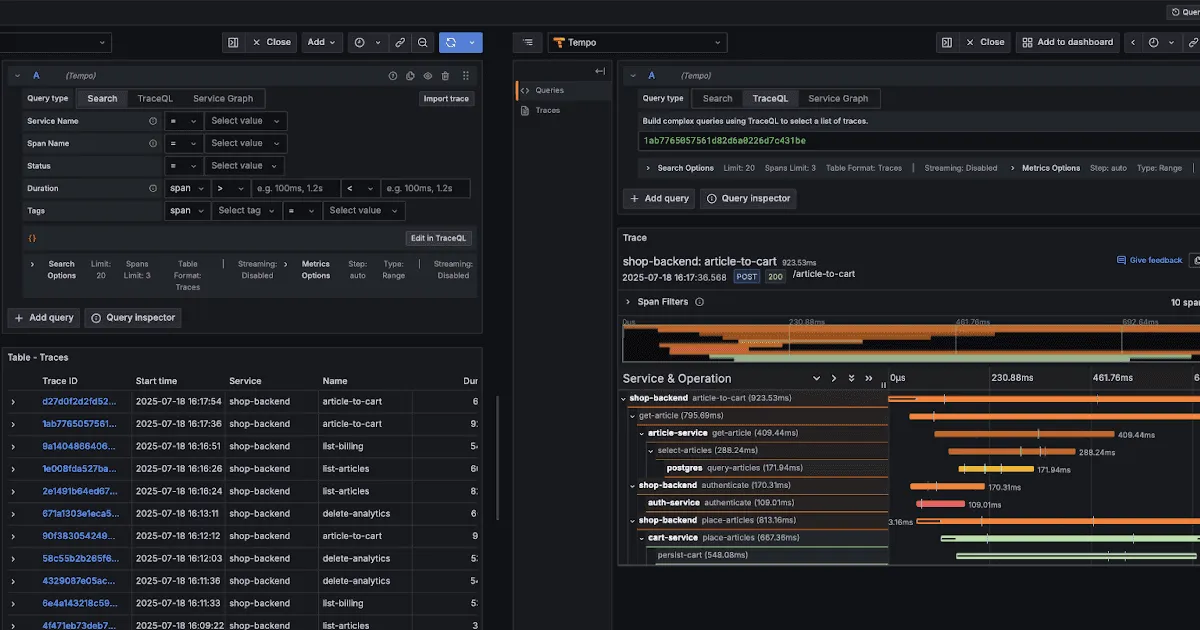
Learn how to spin up Grafana in Docker in 5 real-world examples - Prometheus metrics, Loki logs, Tempo traces, and Pyroscope profiling.
 Featured
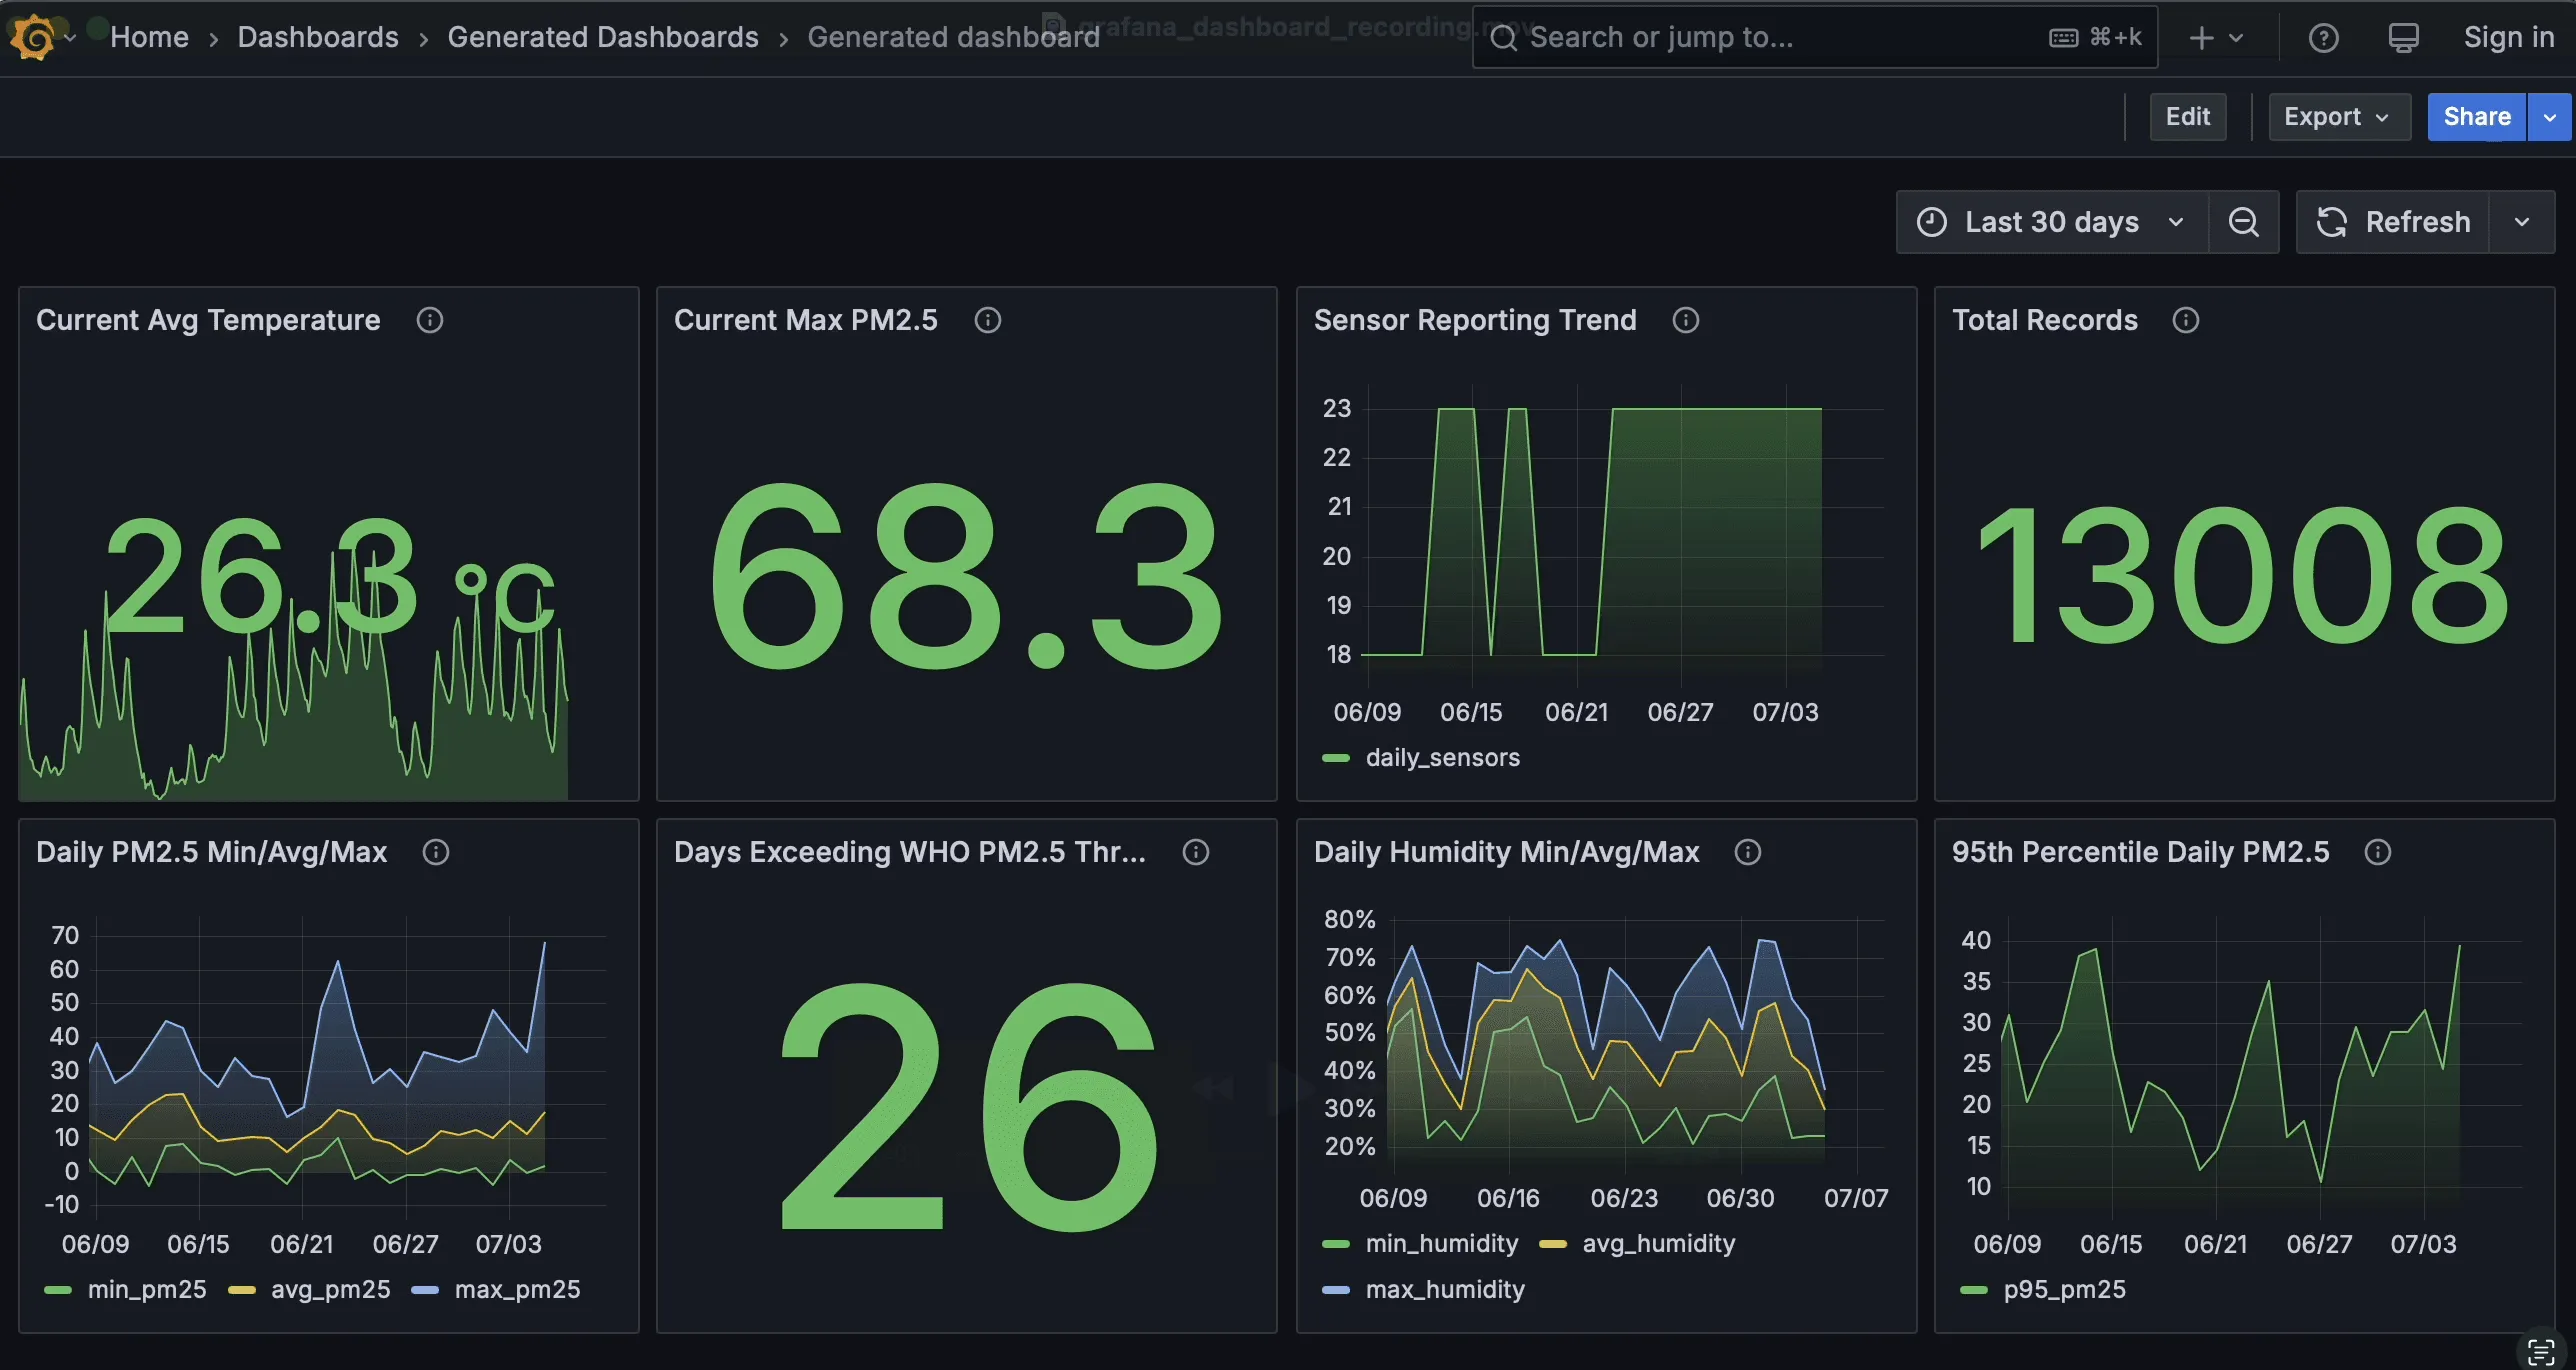
Discover a pragmatic approach to building Grafana dashboards more efficiently by combining the power of AI with the automation of a CLI workflow.