60-Second Linux Analysis - with Nix and LLMs
A one-line command to diagnose server health. Uses Nix to fetch tools without sudo and an LLM to summarize the output. No installation required.
Quesma is a Slack-native operator for Grafana that turns prompts into dashboards, manages alerts, and speeds incident troubleshooting without forcing a new platform. Coming October 2025.
Using Grafana? Talk to our FounderYour tools become smarter overnight. Supports 100+ data sources including PromQL and ClickHouse SQL. Keep your data where it lives. Natural adoption.
Create stunning charts that tell a story. Investigate outages with clear timelines, KPI overlays, and annotated reports. Just by describing and selecting the best.
Open-source and free to install. Casual users can create powerful dashboards. Self-documenting setup in markdown. Reproducible with configuration as code.
Explore our thoughts on data, dashboards, and AI

A one-line command to diagnose server health. Uses Nix to fetch tools without sudo and an LLM to summarize the output. No installation required.

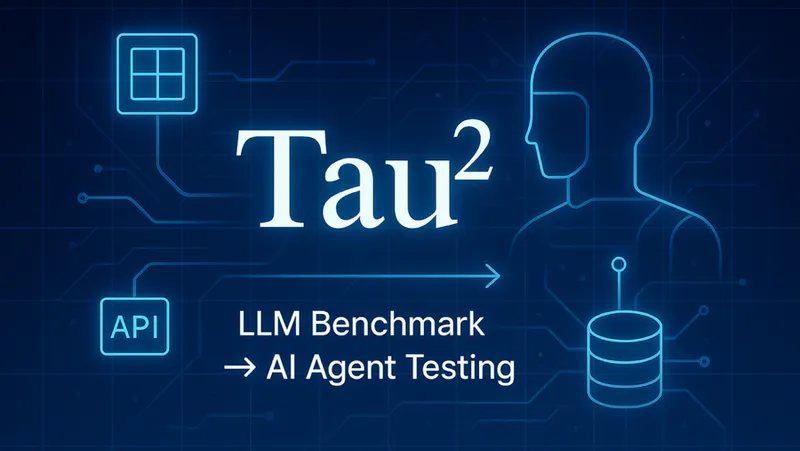
Deep dive into the Tau² benchmark that goes beyond LLM evaluation to reveal innovative methodologies for testing AI agentic systems in realistic scenarios. Learn how this framework can transform how we test AI-powered software.

Learn how Go practitioners ship telemetry in 2025 – what works, what hurts, and the tools, workflows, and guardrails they rely on for metrics, traces, and logs.
Our database proxy for seamless migration between Elasticsearch and ClickHouse.