2026 is the year AI budgets started to burn fast – for many, faster than expected. Token spend became a separate cost category. In August, the Linux Foundation launched the Tokenomics Foundation. Seven weeks later, on September 22–23, we went to Amsterdam for its first event: Tokenomicon + FinOps X.
The conference gathered more than 500 FinOps and tokenomics practitioners – people who manage technology spend. Most talks focused on AI billing and providers. Agentic coding got less attention, even though for many engineering teams it is a fast-growing and poorly understood cost. Billing dashboards show how much was spent and when, but organizations still struggle to prove what that spending achieved.
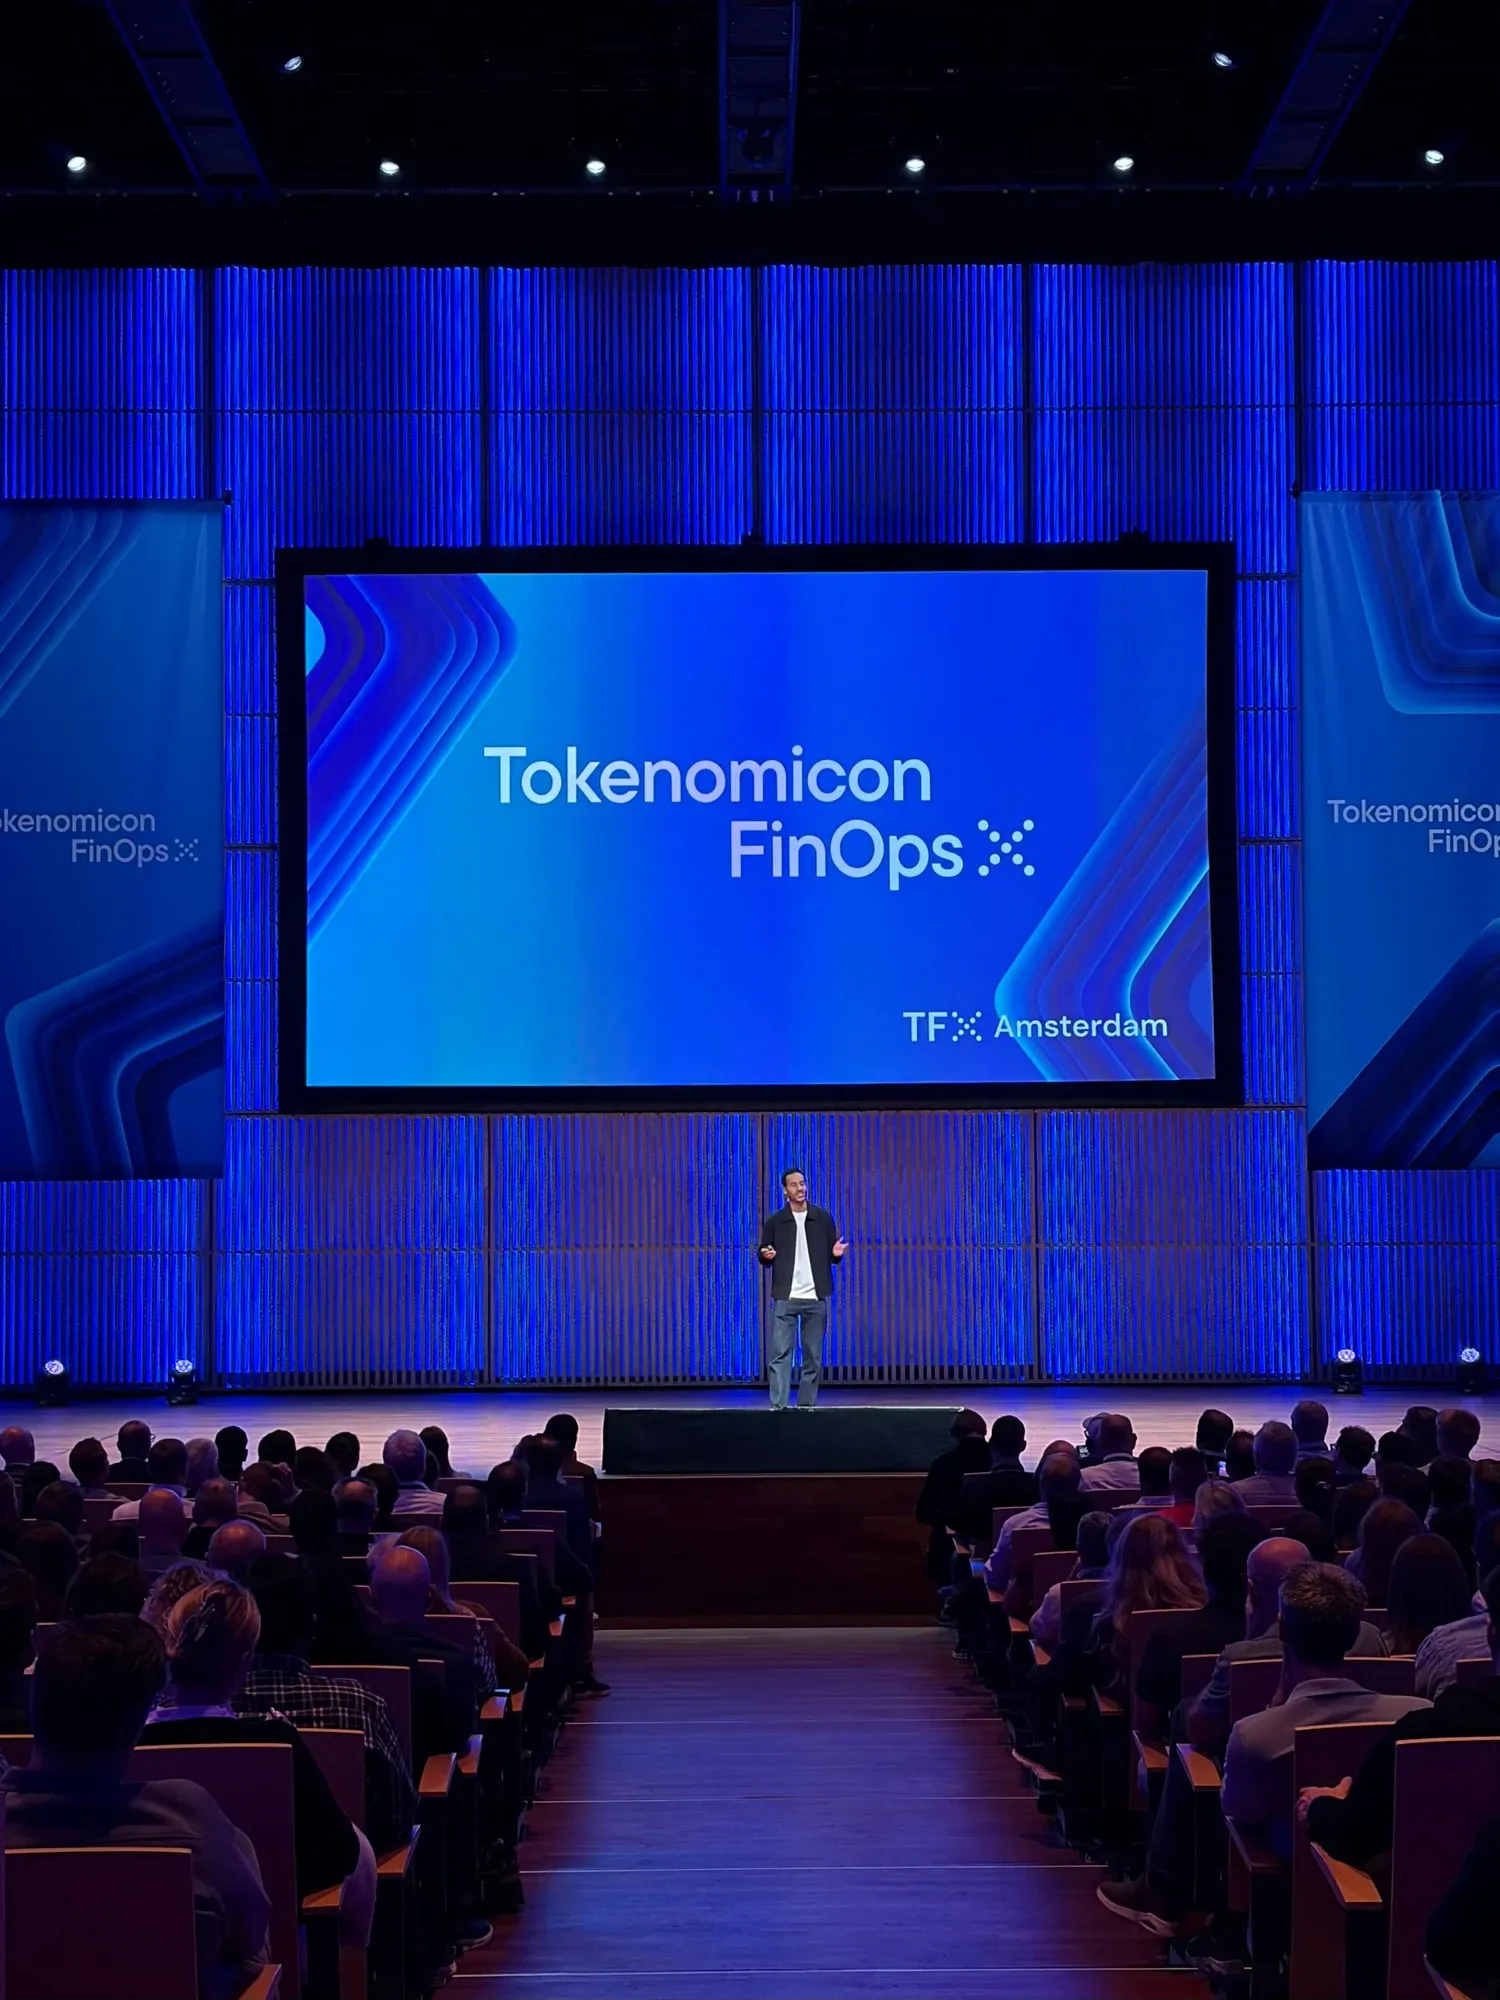
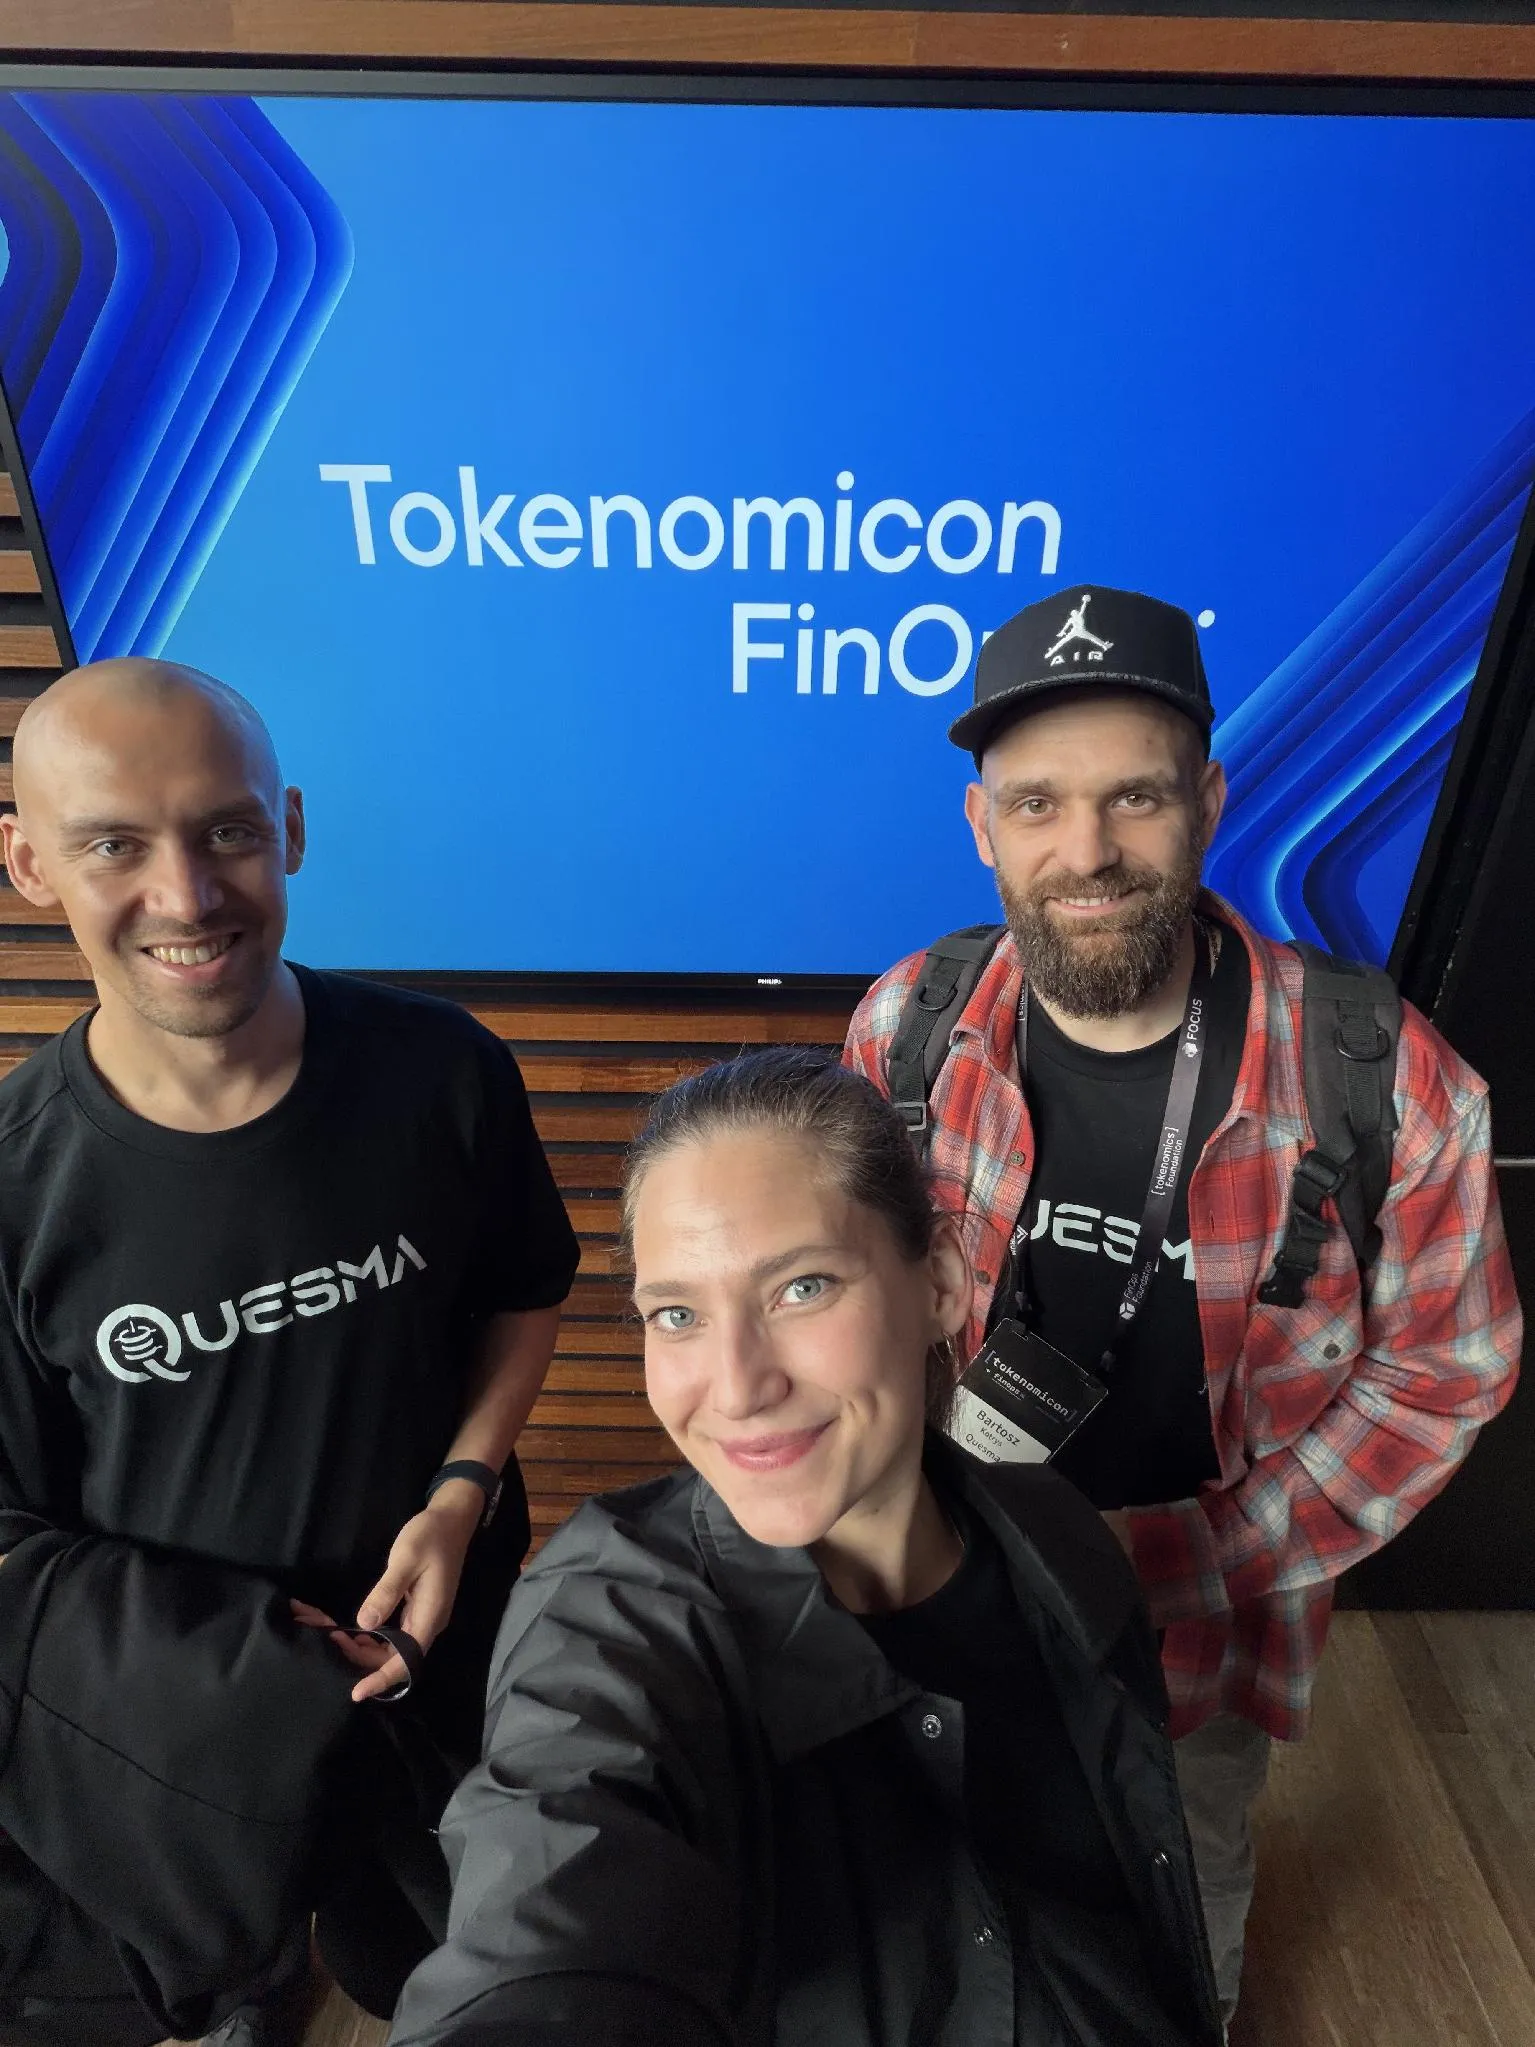
The main stage and the Quesma team at Tokenomicon + FinOps X, Muziekgebouw, Amsterdam.
What the Tokenomics Foundation is building
The Tokenomics Foundation has released Big-T Notation and the Tokenomics Mind Map, and presented both in Amsterdam. Big-T Notation describes how token consumption grows as workflows become more complex. Repeated context, additional model calls, and agents calling other agents can all increase the cost of a task. Similar to how Big-O notation helps estimate computational complexity, Big-T lets teams account for scaling patterns when designing a workflow.
The Tokenomics Mind Map organizes the core terms across the AI supply chain: production, consumption, and value. It gives engineers and finance teams a shared vocabulary for discussing AI costs and outcomes.
Quesma contributed to both projects through the Foundation’s working groups on consumption and AI value.
FOCUS and a common format for AI bills
FOCUS can already record token usage and cost in generic units, and AWS, Azure, and Google Cloud provide billing exports in that format. Planned for later this year, FOCUS 1.5 aims for broader support of AI spend, with:
-
model ID and family,
-
distinction between input, output, and cached tokens,
-
PrincipalId to track the developer, team, or agent behind the usage.
We’d like to see the same approach adopted by Anthropic, OpenAI, and Cursor for their coding agents, so teams can compare what each agent costs without translating invoices first.
Besides billing, there is room for a common format for agentic coding sessions: which model ran, at what effort, what the agent did, and how much it consumed. Connecting those records to billing data would help teams understand the work behind a charge.
Getting caching right
The Tokenomics Foundation released a prompt cache explainer that shows how prompt composition affects caching. You can reorder parts of a request and see how the input cost changes. The optimal order puts fixed tool descriptions, instructions, and context (both retrieved information and accumulated session history) first, and content that changes per request last. This lets the cache skip recomputing identical tokens.
Talks we will return to
PointFive and the cost of a completed task
Alon Arvatz from PointFive shared a prompt compression test where less input led to more reasoning and a higher total cost. That matches what we found with our RTK research: smaller inputs can be offset by extra agent turns. The useful measure is how much it costs to complete the task, including failed attempts.
He also showed how to connect token usage to specific units of engineering work, with a simple chain: coding agent → programming environment → ticketing system. Whatever agent the engineer uses, its session cost is tied to the project, branch, or pull request on their machine, which then links it to a closed ticket. That ticket becomes the unit of work behind the spend.
UNICC and the usage behind a subscription
The UNICC keynote raised a forecasting problem: a subscription invoice shows the price of the licenses, while the activity behind it stays hidden. Before moving that work to API billing, a team needs to know which models it used and how much input, output, and cached context those sessions consumed.
We’d track actual subscription usage alongside an estimate of what the same usage would cost through an API. Reprice the recorded usage by model and token category, then compare it with the subscription charge. That makes it easier to evaluate the potential cost of switching providers. Where the plan does not expose enough usage detail, the estimate needs to show that gap.
Infracost and optimization for a specific workload
Alistair Scott’s talk, Doubling Our Tokens, Keeping the Bill the Same, described Infracost’s internal AI cost-reduction agent. Their dashboard compares provider bills with usage data collected through OpenTelemetry.
Their own AI gateway gives them one place to apply optimizations. To test the changes, they use promptfoo and Langfuse alongside custom tests for their agents.
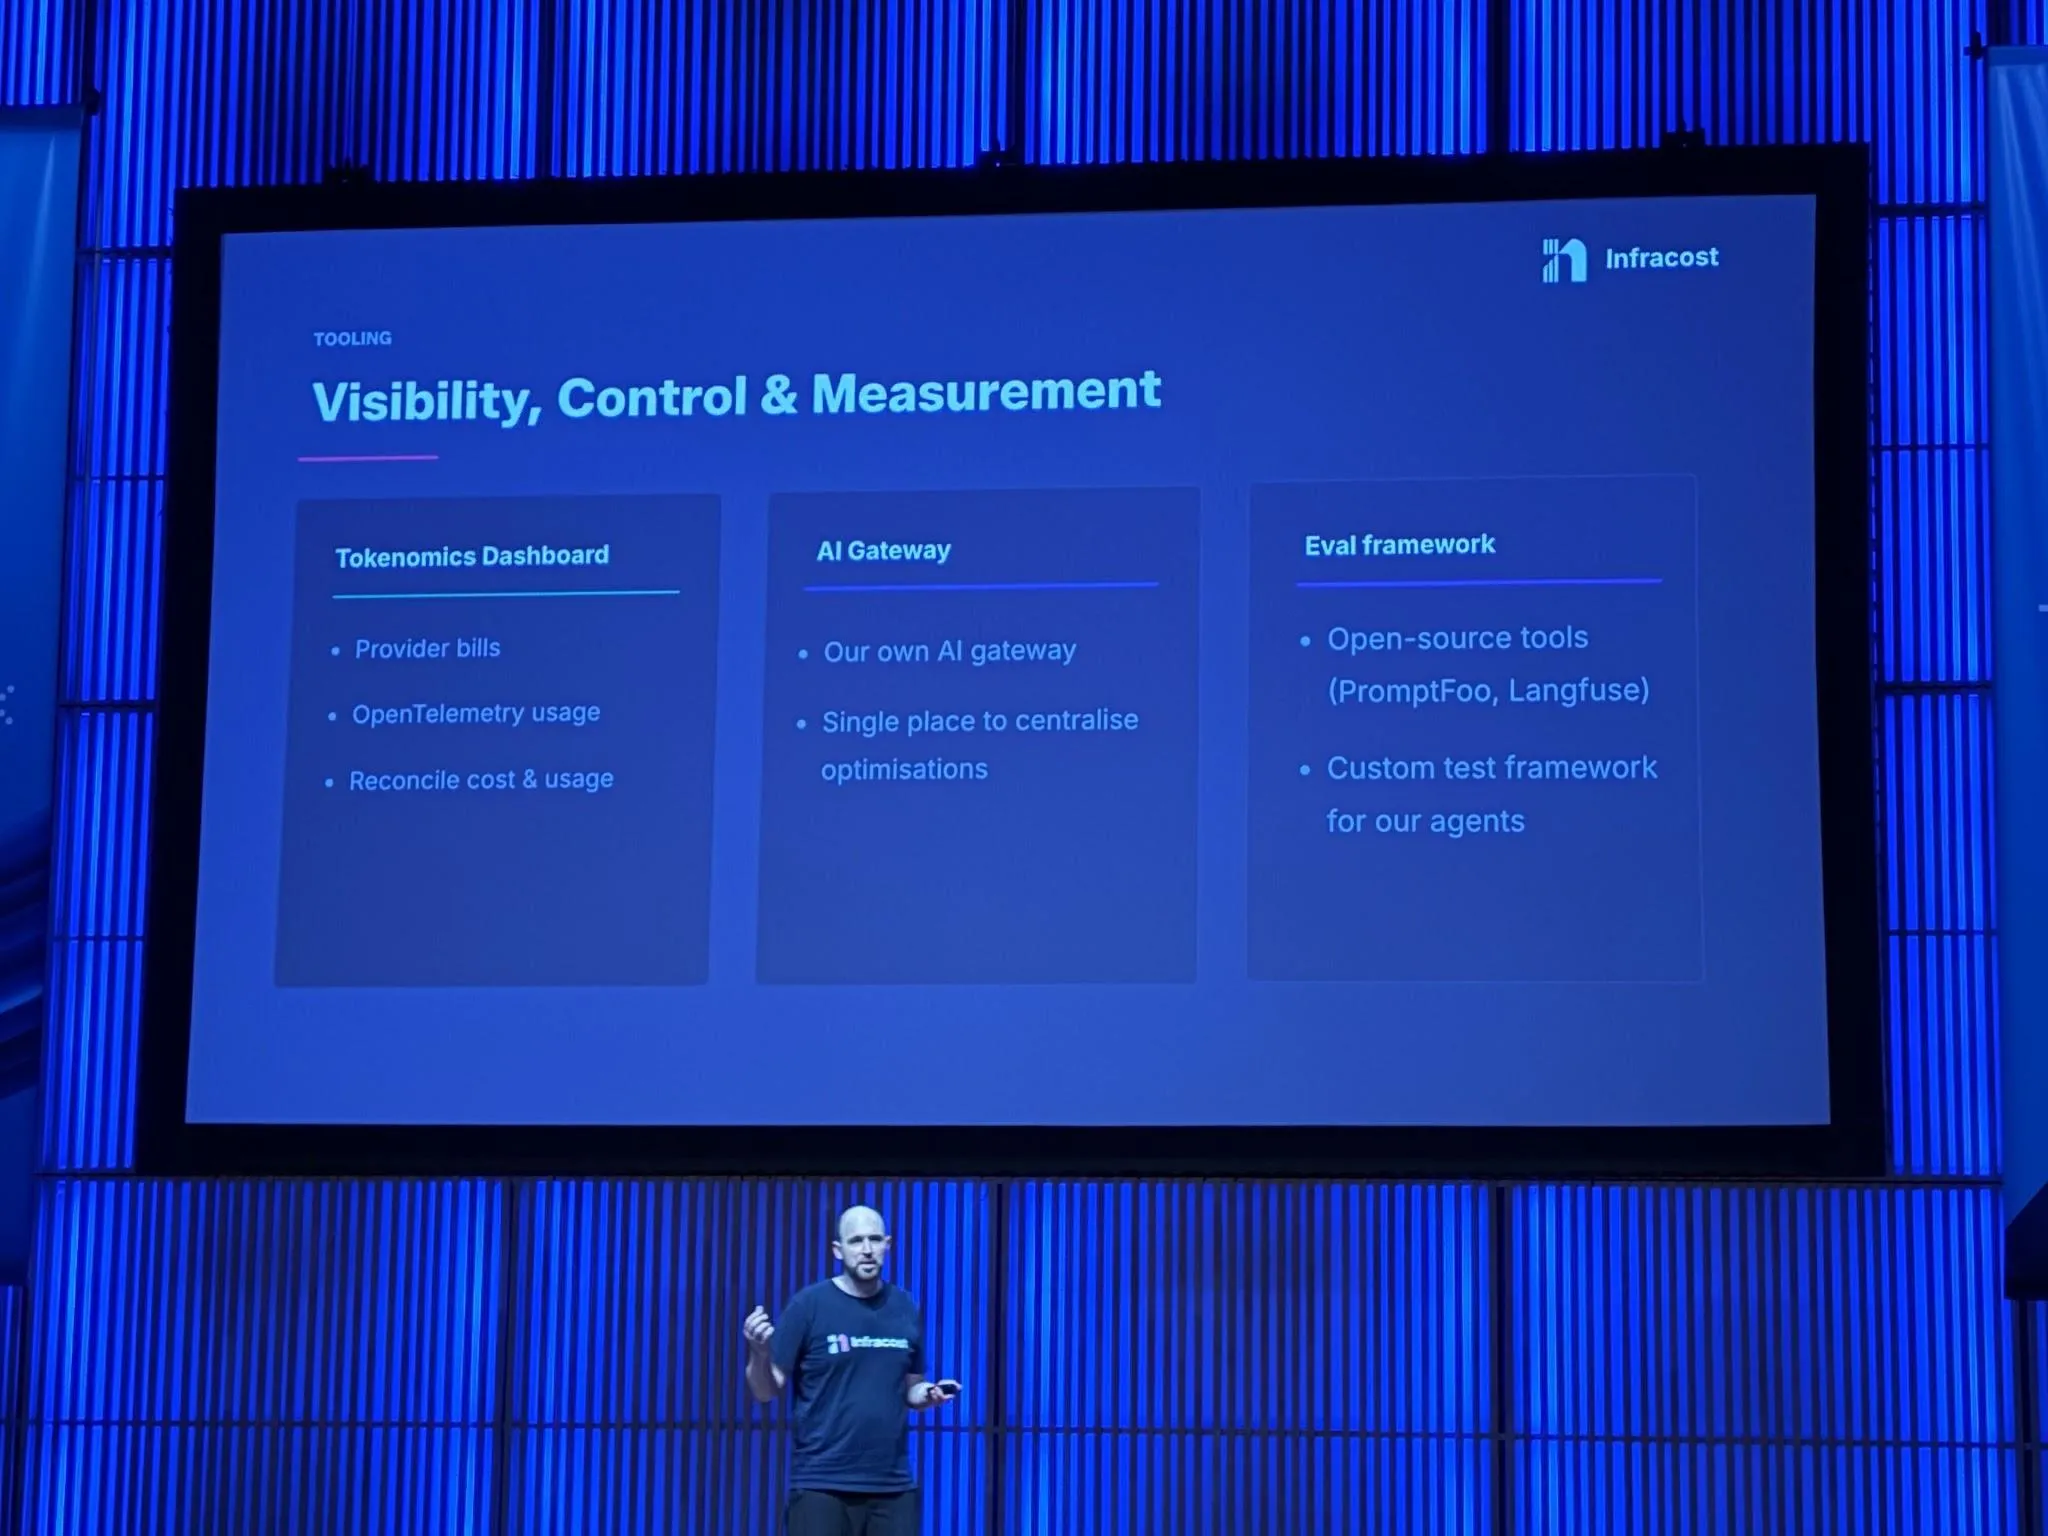
Infracost’s tooling. Photo from Alistair Scott’s talk.
The State of Tokenomics
In the closing keynote, JR Storment presented findings from the Foundation’s September 2026 State of Tokenomics report. The 472 responses across 11 industries give an overview of AI usage at companies with $4.6 trillion in combined revenue. Proving value or ROI was the most frequently named challenge, at 43%. Visibility and attribution of spending followed at 27%. Only 7% named cost or pricing complexity. Clearly, the harder problem is showing what the tokens were spent on and who actually used them.
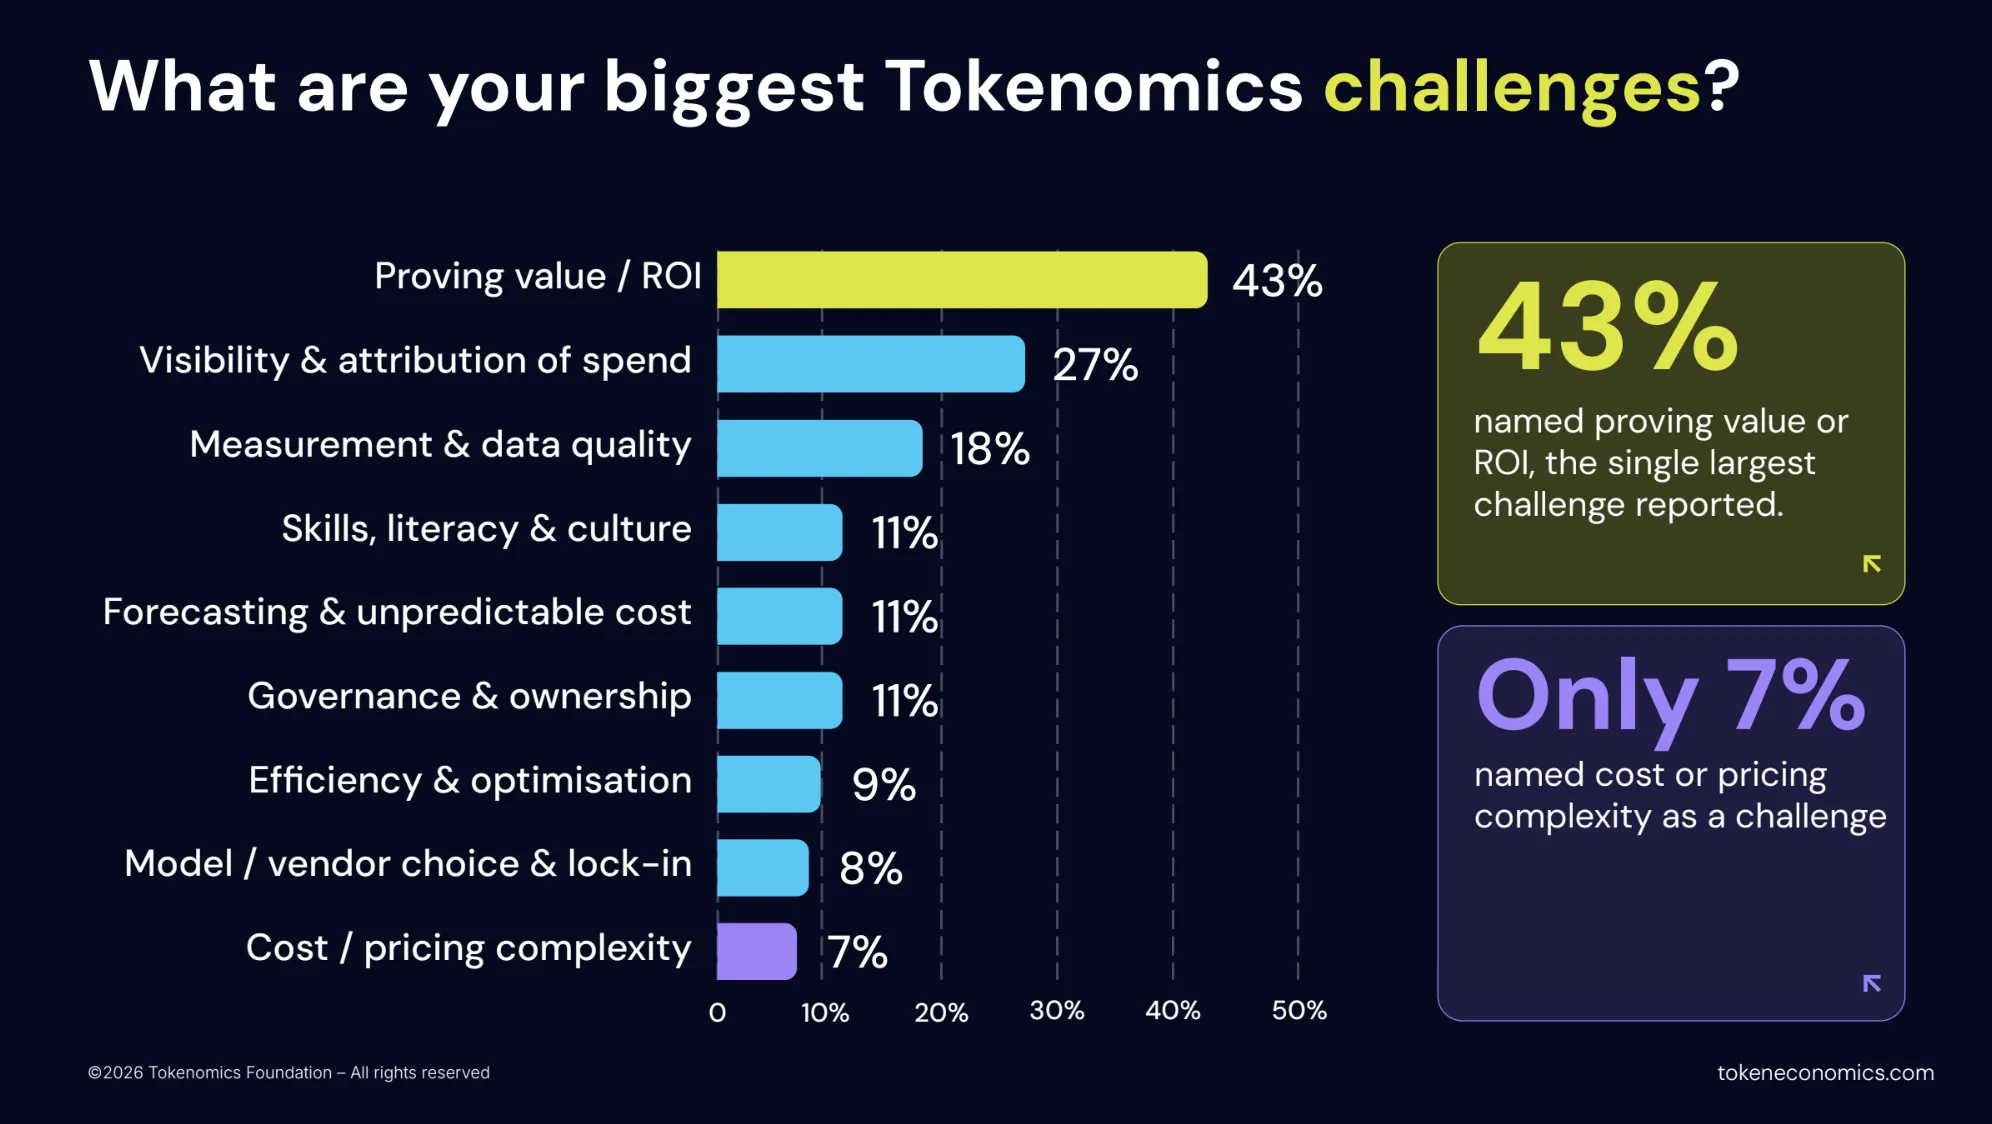
The biggest challenges reported in the September 2026 State of Tokenomics survey. Source: Tokenomics Foundation.
A third of respondents said that a CTO, CIO, or technology function owned AI economics. A quarter shared ownership across the organization, while 12% had no defined owner at all. Not surprisingly, those with clear ownership are almost four times more likely to link the AI spend to a measurable outcome.
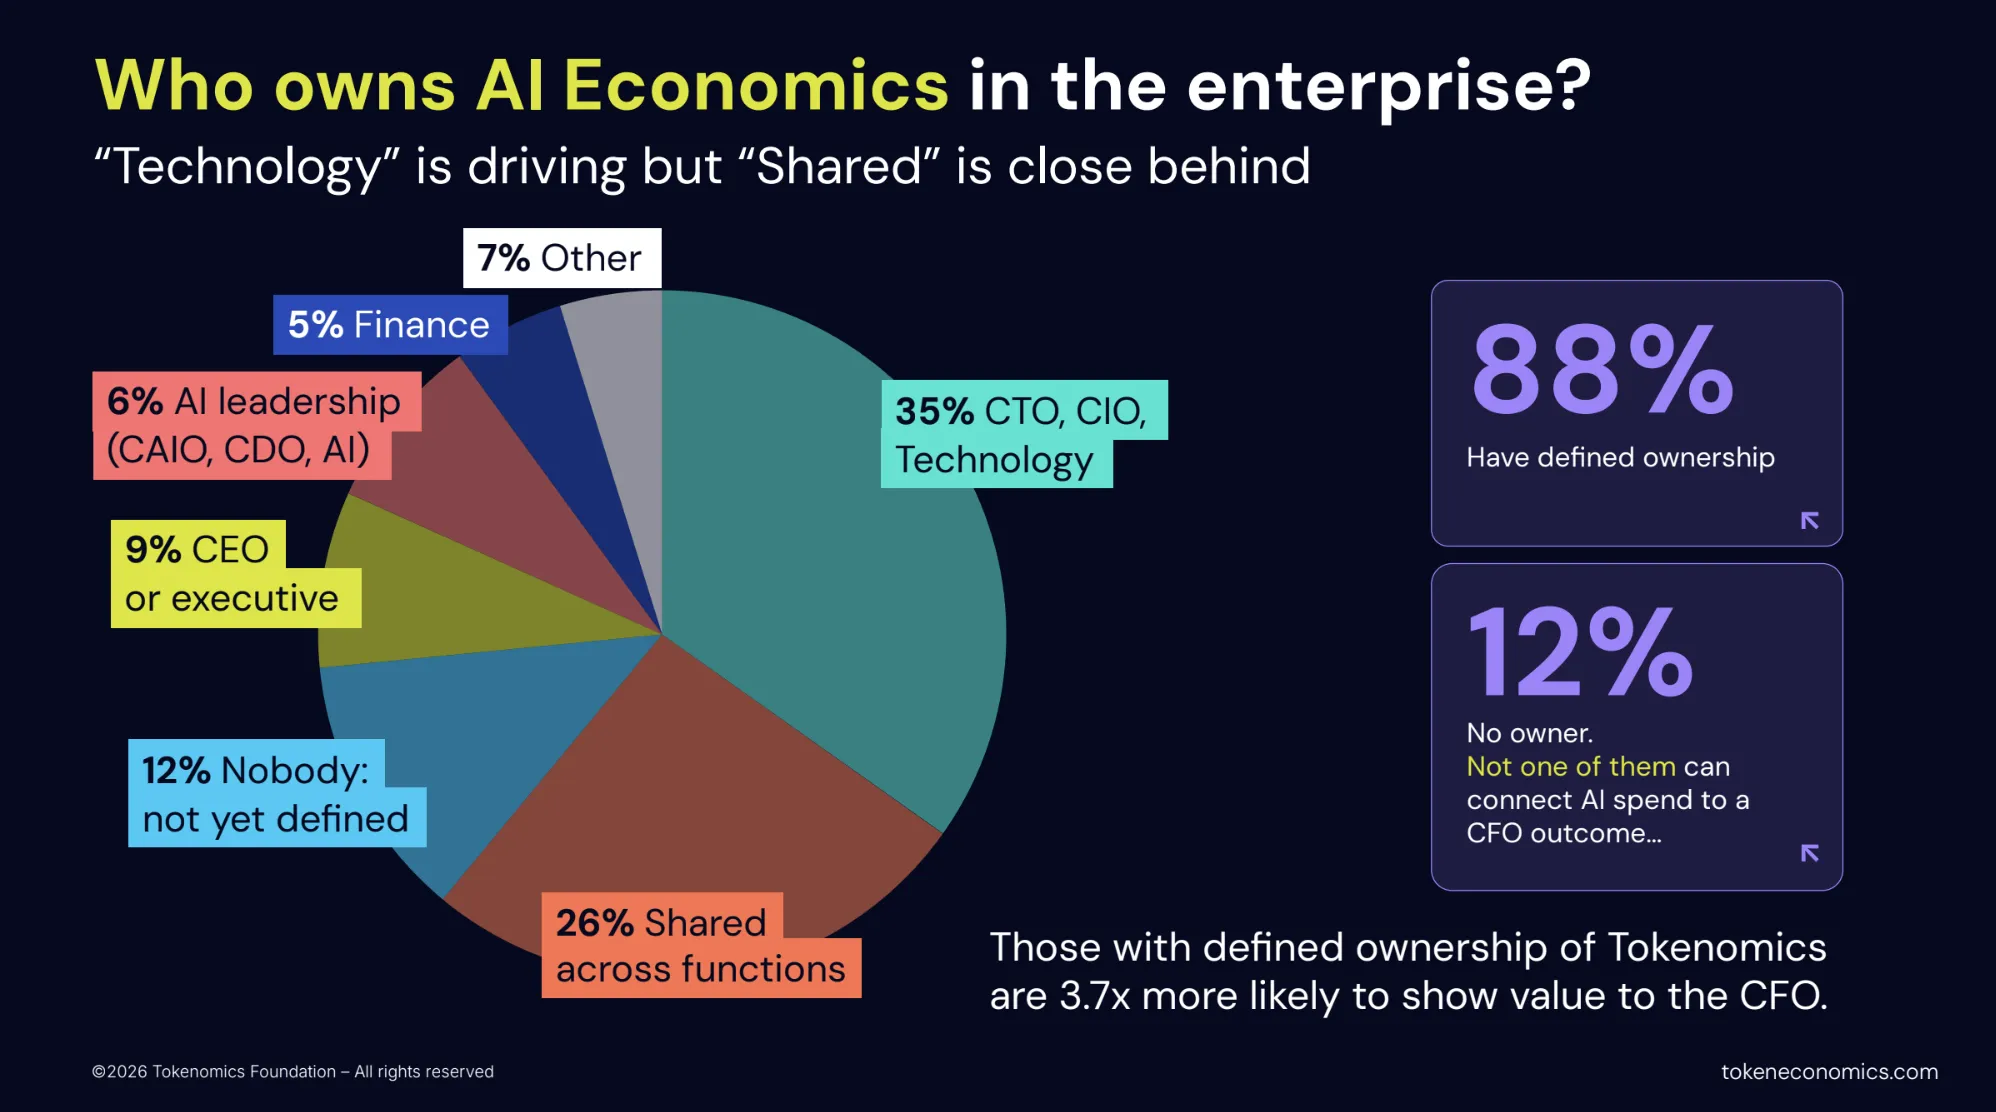
Who owns AI economics in the surveyed organizations. Source: Tokenomics Foundation.
Amsterdam outside the venue
Our favorite part of Amsterdam came after the talks. Małgorzata was especially taken with the Herengracht, calling its canal houses the most beautiful apartments she had ever seen. In the evening, the lights come on behind their tall windows and reflect in the canals, and the whole street glows.
In Dutch Windows, anthropologist Irene Cieraad links open curtains partly to postwar housing and ideals of openness. On streets with good lighting, large windows let residents watch life outside while remaining visible themselves.
And yes, the bikes really are everywhere.

Canal houses in Amsterdam, with the lights coming on in the evening.
What’s next
After Amsterdam, we want to focus our Foundation contributions on coding-agent sessions, the least-understood part of AI costs.
It’s a problem we know well from building our benchmarks. CompileBench, OTelBench, and BinaryAudit measure whether coding agents can complete real engineering tasks, like fixing builds, adding OpenTelemetry instrumentation, or finding backdoors in binaries. Every run also tells us how much each attempt cost, including the ones that failed. Two agents can reach similar results at very different prices, and the reason can be found in their sessions.
Quesma Shipper is our open-source collector for coding-agent sessions from Claude Code, Codex, and Cursor.
We want to bring our experience to the Tokenomics Foundation. Our contribution to the Tokenomics Landscape is already confirmed. We’ll keep working in the Consumption and AI Value working groups, and we plan to contribute to future versions of FOCUS.
If you’re trying to understand what your coding agents did, what that cost, and what your team got back – reach out to us!