Claude Code + OpenTelemetry + Grafana: A guide to tracking usage and limits
Hitting your Claude Code limit mid-sprint feels less like a feature and more like a bug you can’t fix. One minute you’re deep in the flow, the next you’re staring at a lockout that can last for hours or even an entire week, just two prompts short of a breakthrough. This isn’t just an inconvenience; it’s a major roadblock that kills momentum.
This creates a difficult choice. Pay-per-token API access gives you a limitless runway but threatens a surprise bill. Meanwhile, the Pro and Max plans promise predictability but deliver opaque, shifting limits that create an unpredictable barrier to getting work done. Whether you’re a solo dev rationing prompts or a manager trying to forecast a budget, you’re flying blind without a way to monitor usage.
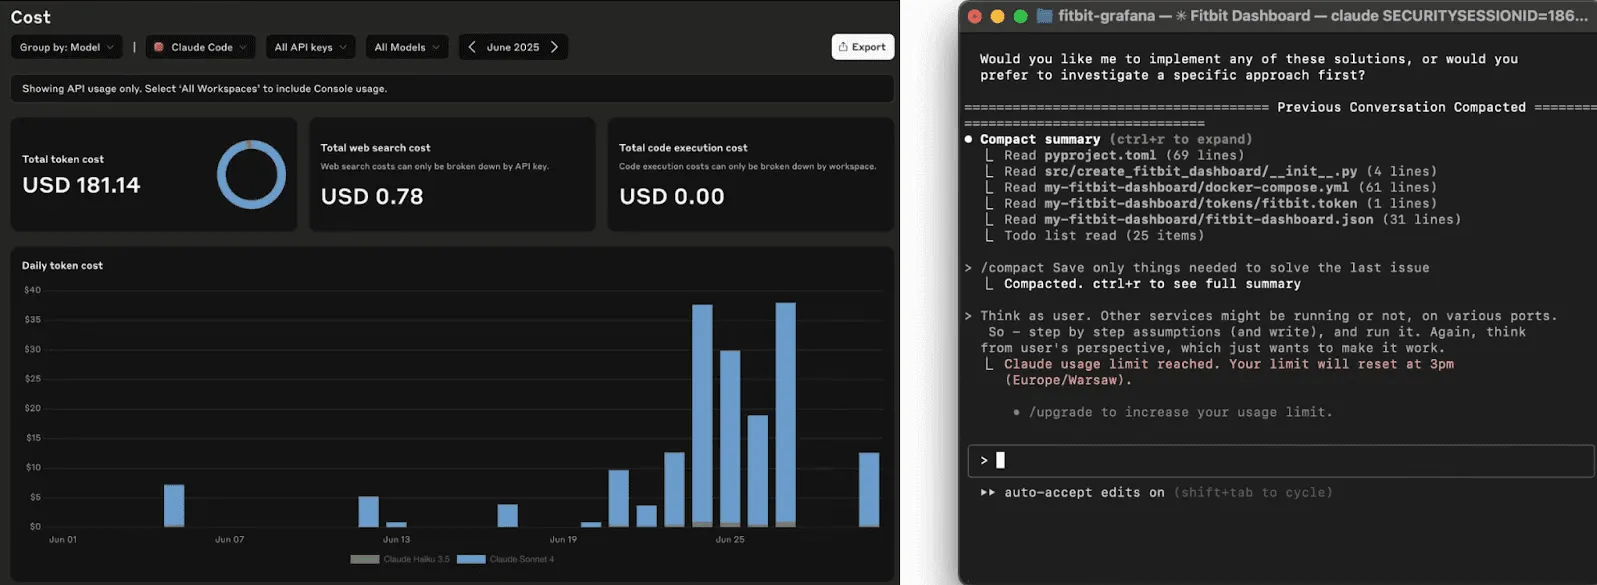
Pick your poison: a surprise bill that burns your budget, or a hard limit that kills your momentum.
There are several ways to monitor Claude Code, but some are overly ambitious. For example, you could use a custom script that monitors local usage, but it’s a clunky, manual solution that doesn’t scale. Or, you could deploy a full-blown observability stack with Docker, Prometheus, and Grafana—powerful, but complex. Another common approach is routing traffic through a proxy like LiteLLM, but for just one model, it’s like renting a crane to hang a picture.
Here’s the better way: Claude Code supports OpenTelemetry (OTEL) out of the box, a vendor-neutral standard for collecting performance data like metrics and logs from your applications. This native support means no extra services, wrappers, or hacks are needed. You just enable it in the config and send the telemetry directly to a collector. In my case, that’s a Grafana Cloud endpoint, which is free to start and requires no servers to manage.
It takes five minutes. Once configured, usage metrics flow directly into Grafana. You get visibility, alerts, and dashboards with zero nonsense.
Below, I walk you through the exact setup I use, with screenshots and config examples.
Setting up Grafana Cloud for Claude Code monitoring
To receive telemetry from Claude Code, we’ll use Grafana Cloud’s built-in OpenTelemetry endpoint. The free tier is enough for basic usage monitoring, and you don’t need to run any collectors yourself. Here’s how to get it set up:
1. Sign up for Grafana Cloud
Go to https://grafana.com and create a free account if you don’t have one yet.
2. Open the Grafana Cloud Portal
After signing in, go to the Grafana Cloud Portal (at https://grafana.com/orgs/YOUR-ORG/cloud), not the Grafana app UI. This is where you manage your infrastructure, instances, and tokens.
3. Select your Grafana Cloud instance
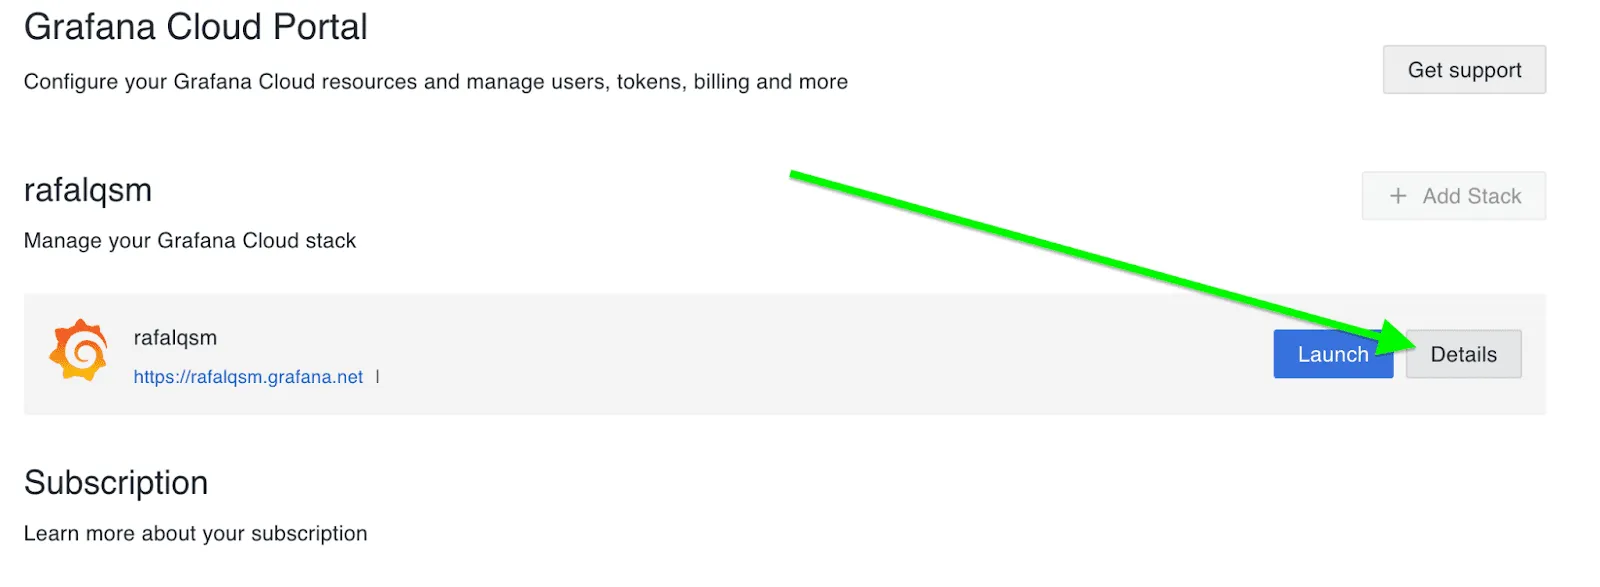
In the portal, find your cloud stack and click Details. You’ll see your active services – Grafana, Loki, Tempo, etc.
4. Configure OpenTelemetry
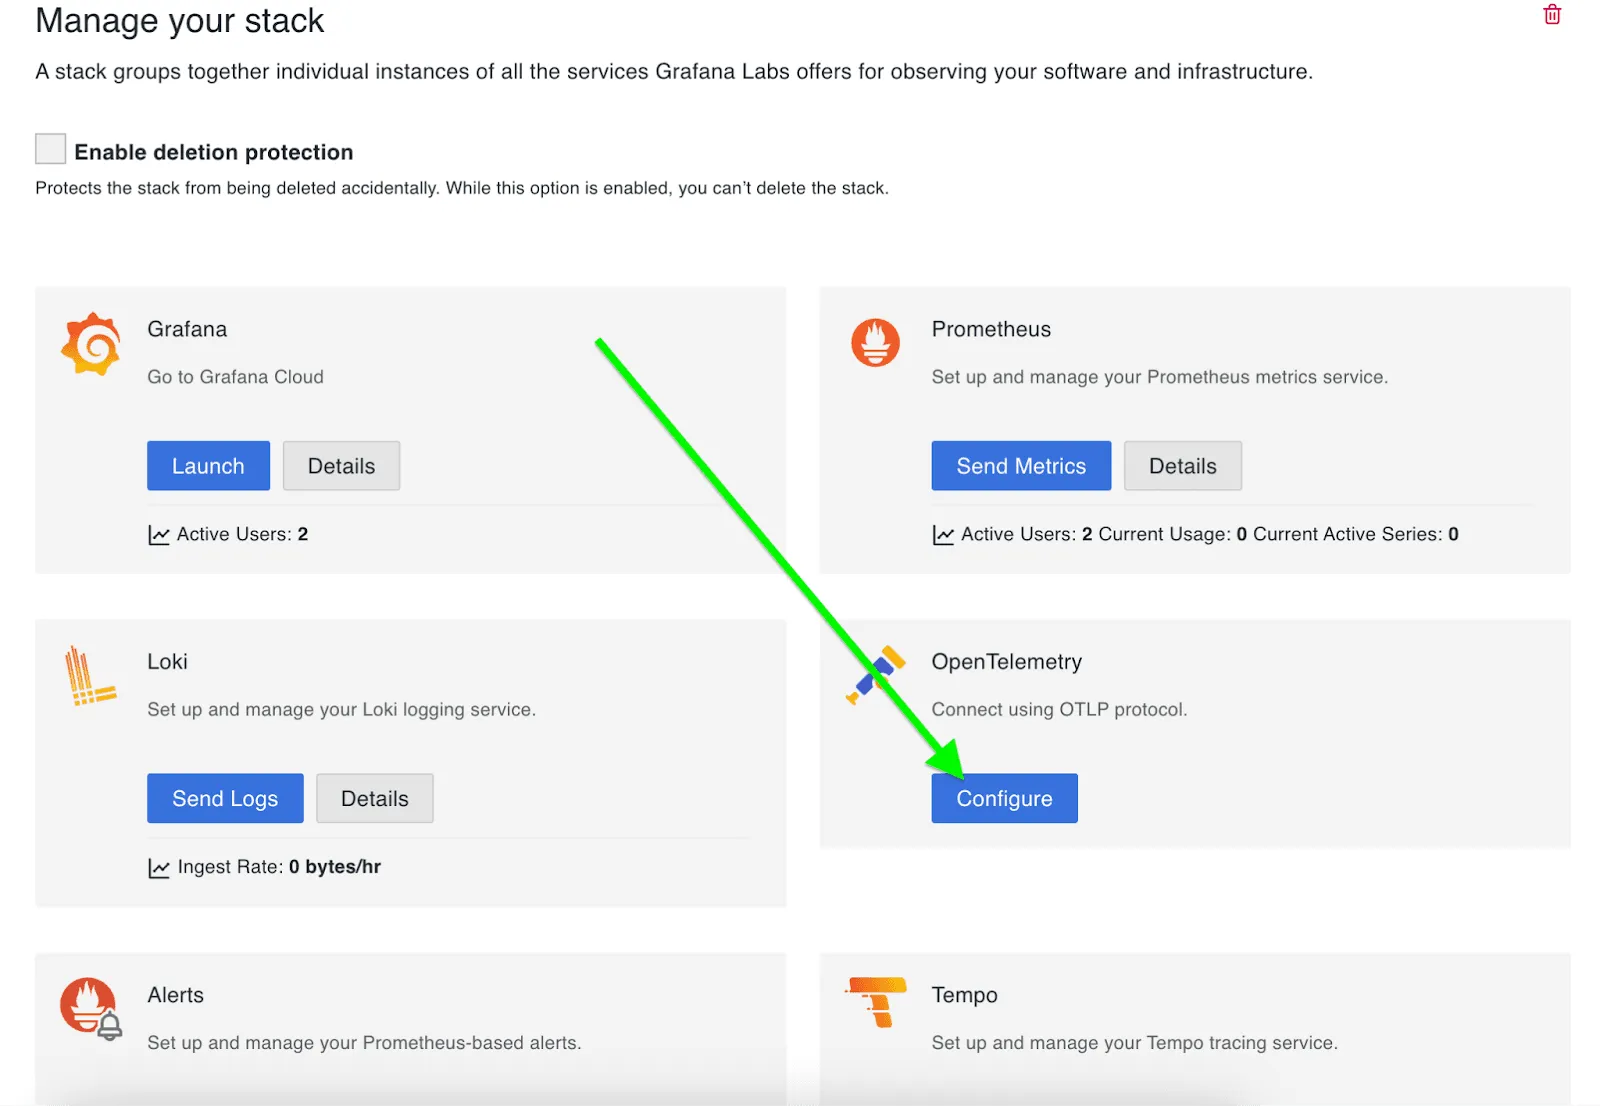
Scroll down to the OpenTelemetry section and click Configure.
5. Generate an API token
Click Create API Token, give it a name, and make sure it has the required OTLP ingest permissions.
Save this token somewhere safe – you’ll need to place it in your Claude Code config later.
Configuring Claude Code to send telemetry
Once your Grafana Cloud endpoint is ready, it’s time to configure Claude Code to start sending telemetry. Claude has built-in OpenTelemetry support – no wrappers, no sidecars.
Before launching Claude Code, load these environment variables into your shell:
export CLAUDE_CODE_ENABLE_TELEMETRY=1
export OTEL_METRICS_EXPORTER=otlp
export OTEL_LOGS_EXPORTER=otlp
export OTEL_EXPORTER_OTLP_PROTOCOL="http/protobuf"
export OTEL_EXPORTER_OTLP_ENDPOINT="https://otlp-gateway-prod-eu-north-0.grafana.net/otlp"
export OTEL_EXPORTER_OTLP_HEADERS="Authorization=Basic PLACE_YOUR_TOKEN_HERE"
export OTEL_METRIC_EXPORT_INTERVAL=10000
export OTEL_LOGS_EXPORT_INTERVAL=5000
This config enables telemetry, sets up OTLP (OpenTelemetry Protocol) for both logs and metrics, and defines how often data is sent. You don’t need to install any collector – Claude Code handles it internally.
Exploring logs and building a dashboard in Grafana Cloud
Once you’ve connected Claude Code to Grafana Cloud, the logs will show up in Loki, Grafana’s log aggregation backend. Claude emits structured logs for each event, such as api_request or tool_result. You can search and filter them directly in the Explore tab.

Loki supports a query language called LogQL. It lets you extract metrics directly from logs, so that you don’t have to export metrics separately.
A starter dashboard: Four key metrics we track
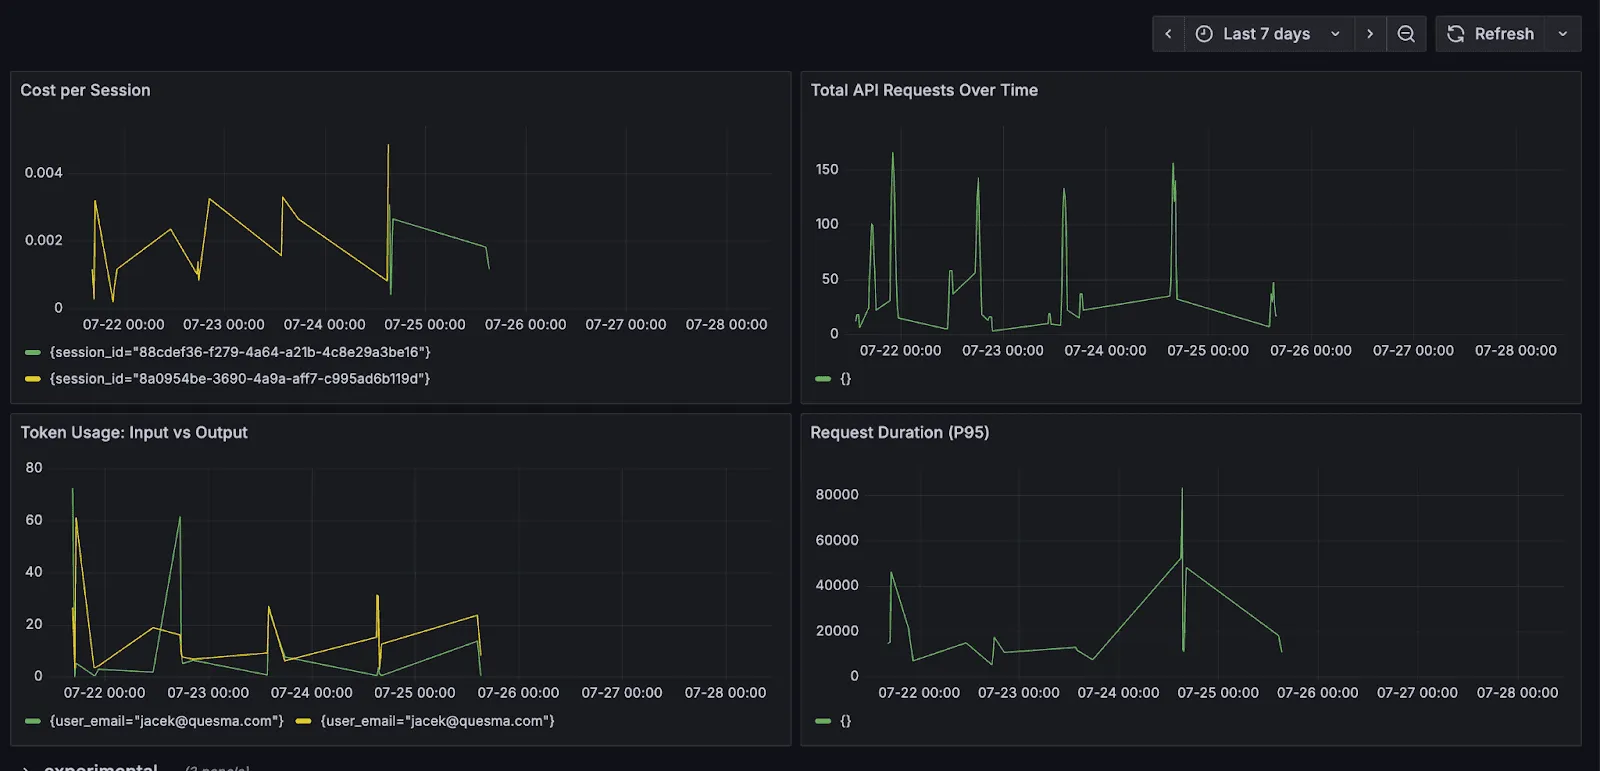
Once your logs are flowing into Grafana, you can build a dashboard to visualize what’s happening. Our dashboard is built around four key metrics that provide a clear view of usage, performance, and cost. Think of these as a practical starting point:
- Total API Requests Over Time: This tracks baseline activity and helps us identify trends or usage spikes.
- Total Token Usage (Input + Output): We measure how much data is sent and generated, which is essential for tracking our costs.
- Cost Estimate per Session: This gives us direct visibility into how expensive each user interaction or task becomes.
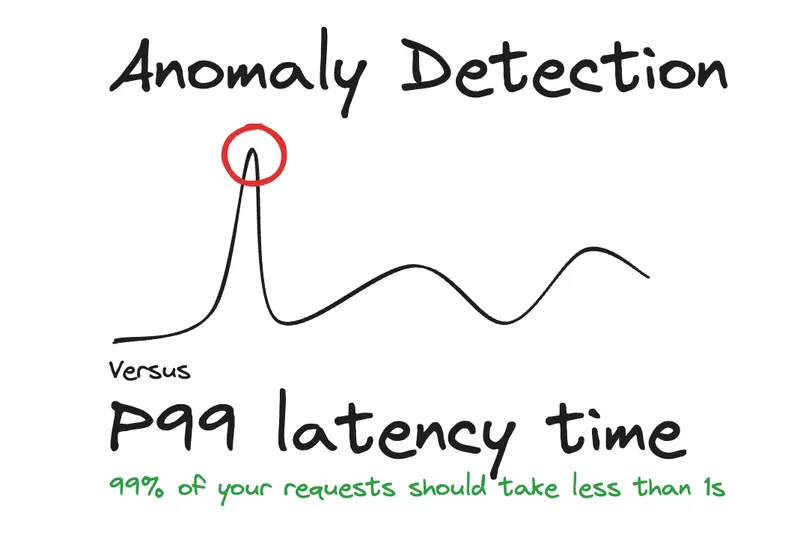
- Slow Requests (P95/P99 Latency): This helps us spot performance issues by focusing on the longest-running requests that have the biggest impact on user experience.
Summary
The built-in OpenTelemetry support in Claude Code is the real winner. This is how any tool that burns money per use should ship: with native telemetry, no wrappers, and a direct push to your backend. Grafana Cloud is a great match—the setup is simple, its free tier is enough to get started, and it requires no extra infrastructure. You get structured logs flowing into Loki out of the box.
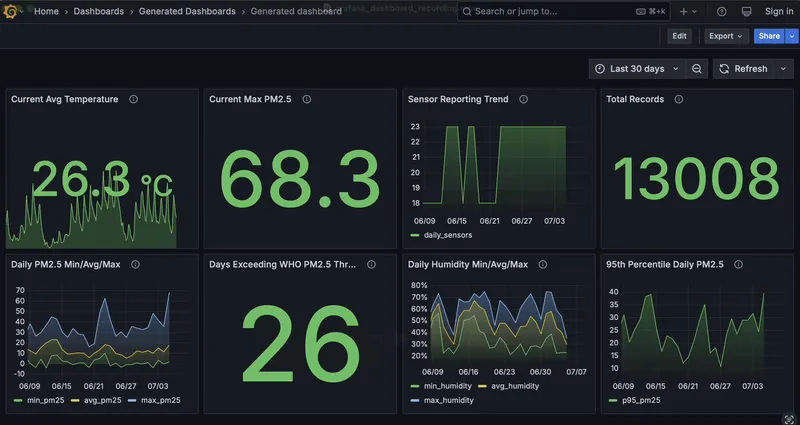
The main hurdle remains the dashboarding. Creating a meaningful Grafana dashboard isn’t trivial; it takes manual effort and knowledge of PromQL or LogQL. While getting the telemetry data is 90% of the battle, that last 10% is still a chore.
For us, this is the most direct path to getting control over Claude Code’s costs. But how are other teams tackling AI observability and budget tracking? We’re keen to hear what works, what doesn’t, and what we might be missing.
Discuss this post on Hacker News.
Stay tuned for future posts and releases
