Getting started with Quesma in 3 simple steps
This will be quick. Not because we don’t like writing (though we’d rather be building), but because there’s not much to say — setting up Quesma is dead simple. Thanks to GitHub and Docker, you’ll be up and running in no time. Prefer to watch instead? Check out this video:
Prerequisites
You need to have a Git client (e.g. GitHub Desktop) and Docker (e.g. Docker Desktop) installed on your computer.
Clone the repo and start the Docker containers
For more detailed instructions, visit our GitHub page. The process is simple:
- Clone the repo: Choose a directory and clone the Quesma repository. You can use the
git clonecommand or the GitHub UI. - Run Docker Compose: Use the provided
docker-composefile to create and run a set of Docker images. This will spin up Quesma along with a complete demo environment featuring Elasticsearch, Kibana, and ClickHouse. Just paste this into your terminal and you’re good to go:git clone https://github.com/QuesmaOrg/quesma.git && docker compose -fThe first command clones the Quesma repo: The second command creates and launches 7 containers (we are not only running Quesma here but a full demo setup with Elasticsearch, Kibana, and ClickHouse):
 You can also see that in Docker Desktop:
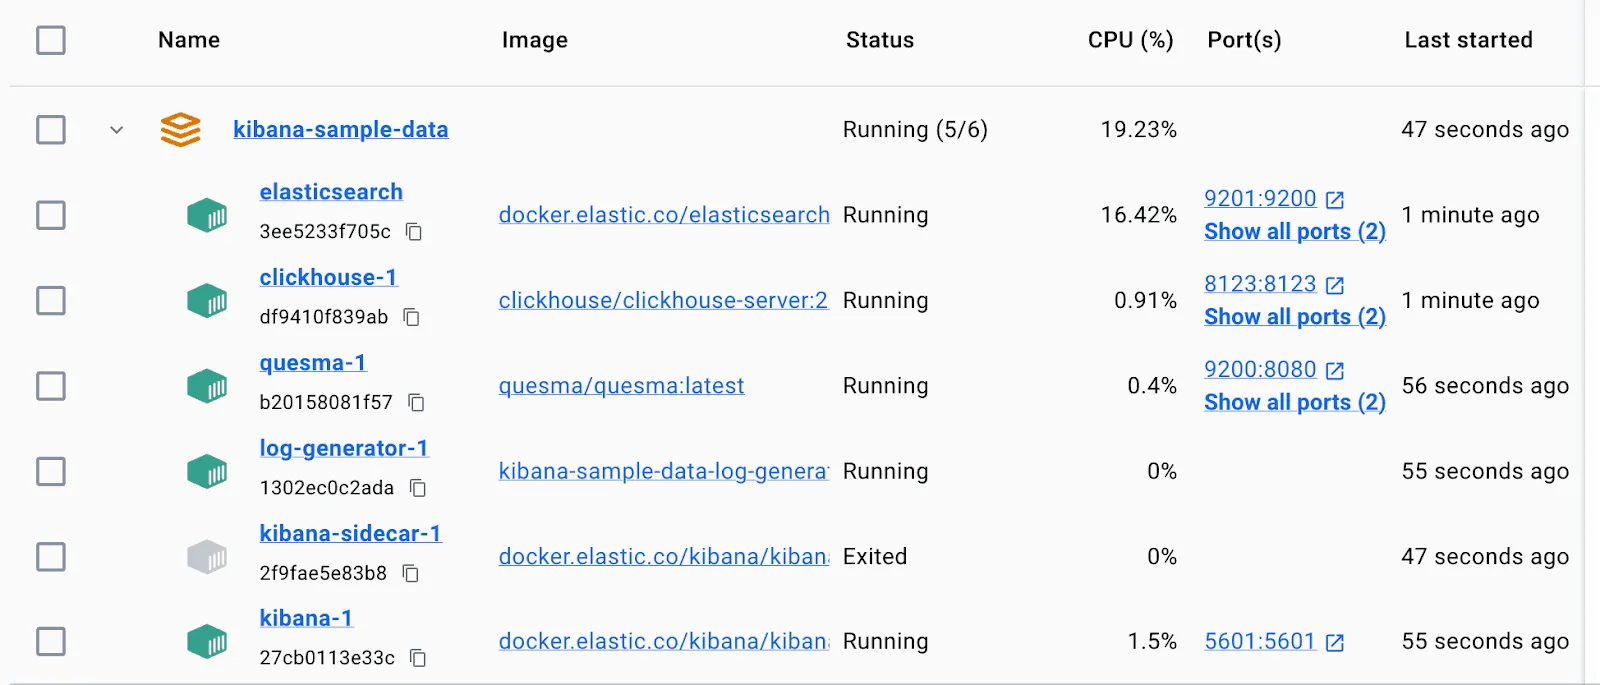 It is fully OK to see
 kibana-sidecarexit after a while.
Browse the data
You are all set. Let’s go to Kibana and browse some data: go to http://localhost:5601
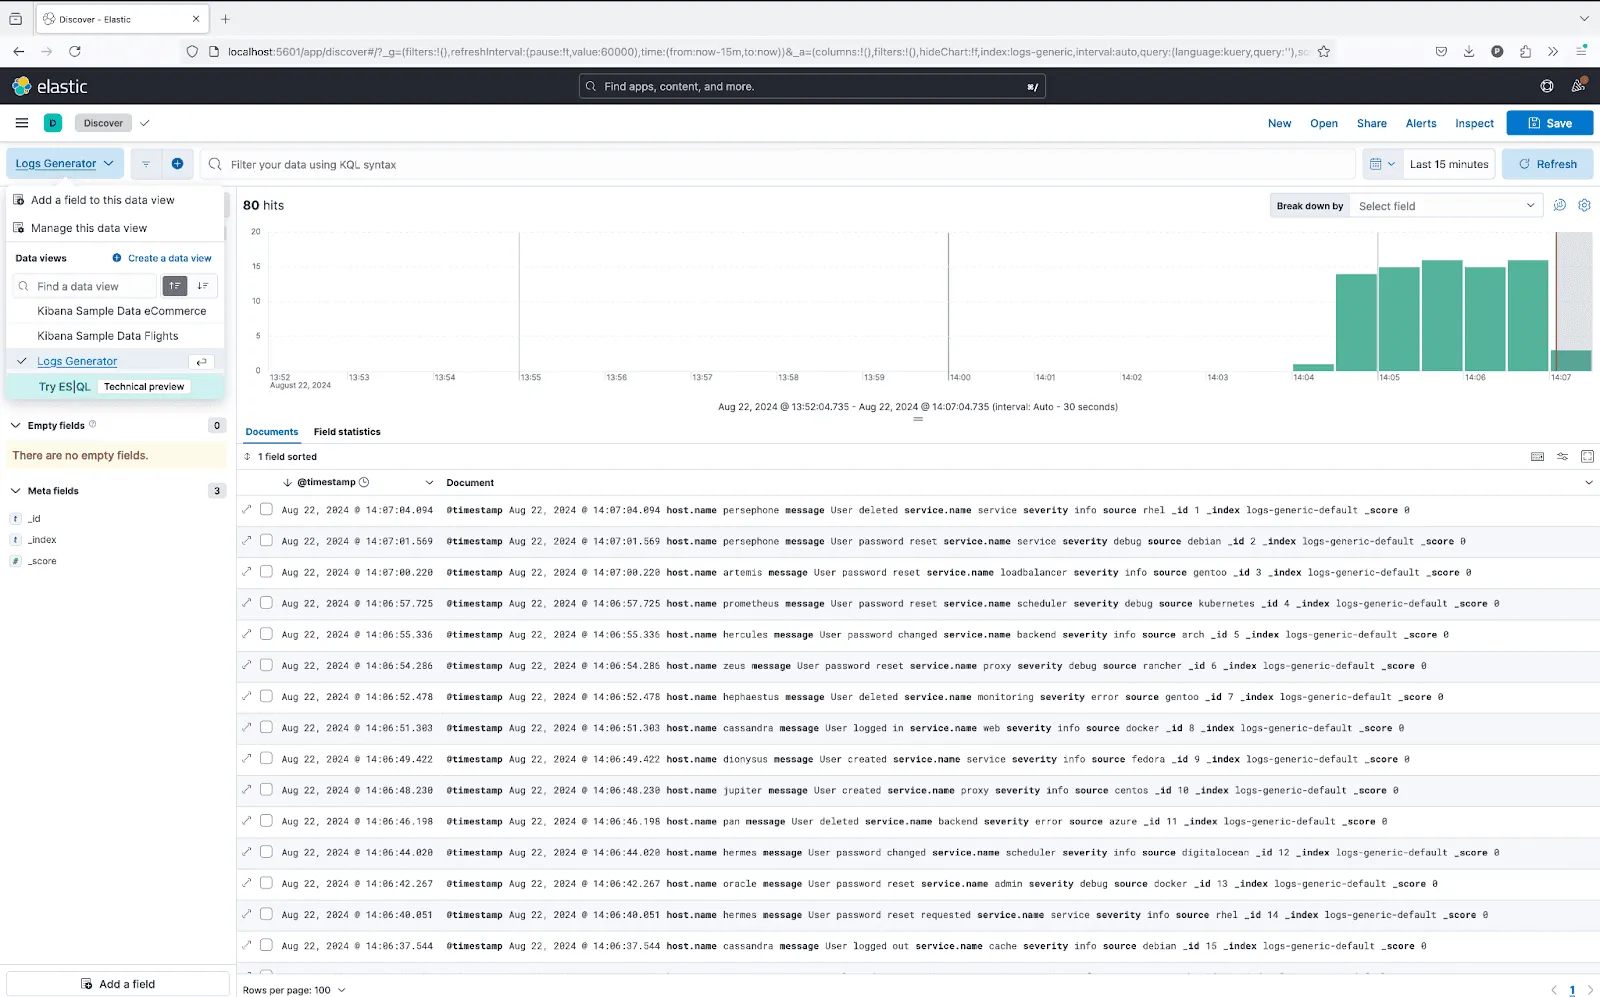 You can pick from 3 data sources - standard Kibana demo sample sets and our own “Logs Generator” sample. Feel free to use the Discover and Dashboards interfaces, these are the main ones supported. You can also set up events.
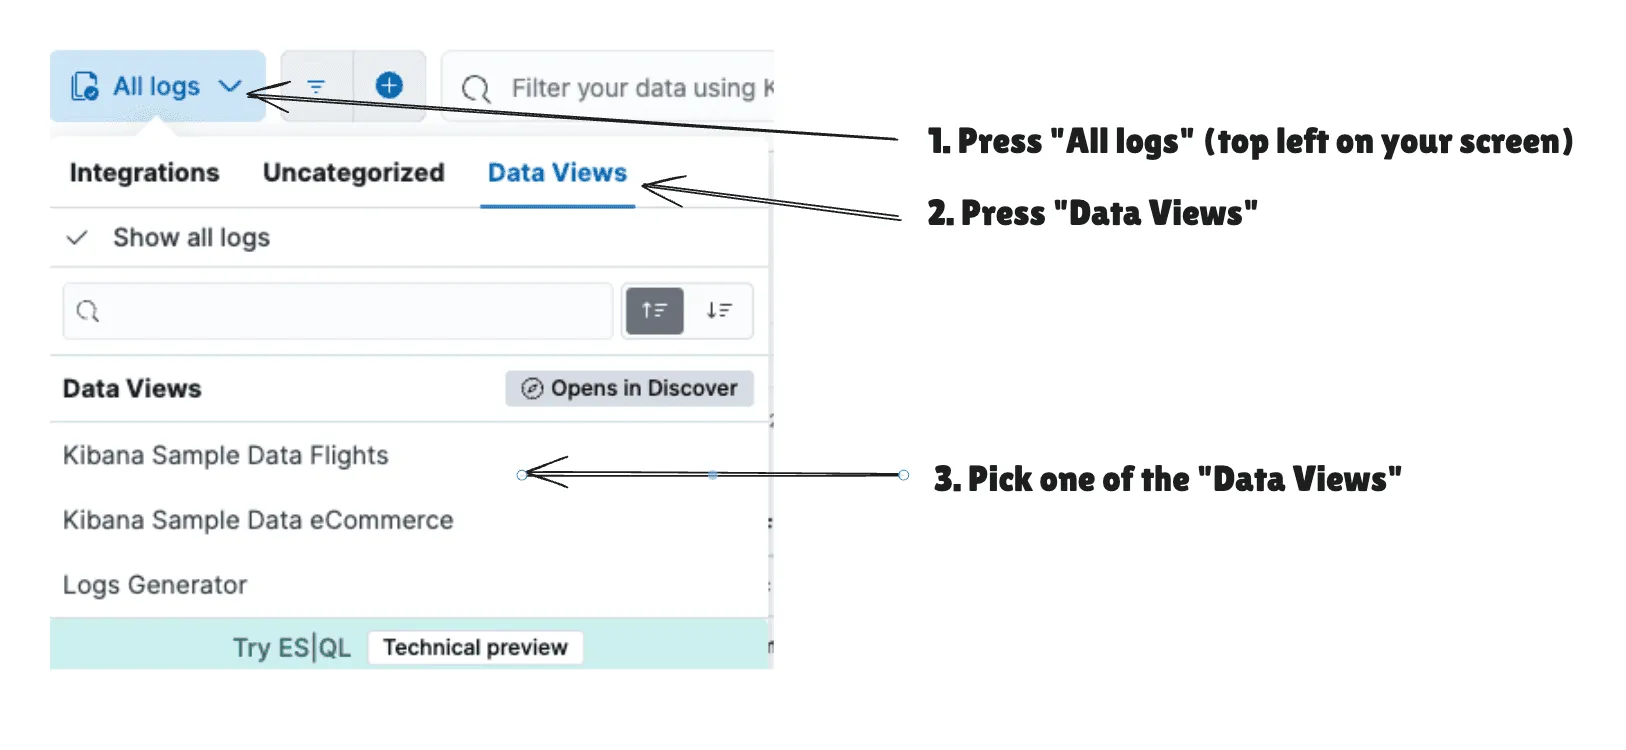 Note - all the data comes from ClickHouse - you can check it in its Play interface at http://localhost:8123/play
select top 100 * from "logs-generic-default"
select top 100 * from "kibana_sample_data_flights"
select top 100 * from "kibana_sample_data_ecommerce"
If you are interested how Quesma sees these tables and how the query translation process works internally, you can access Quesma’s management interface at http://localhost:9999
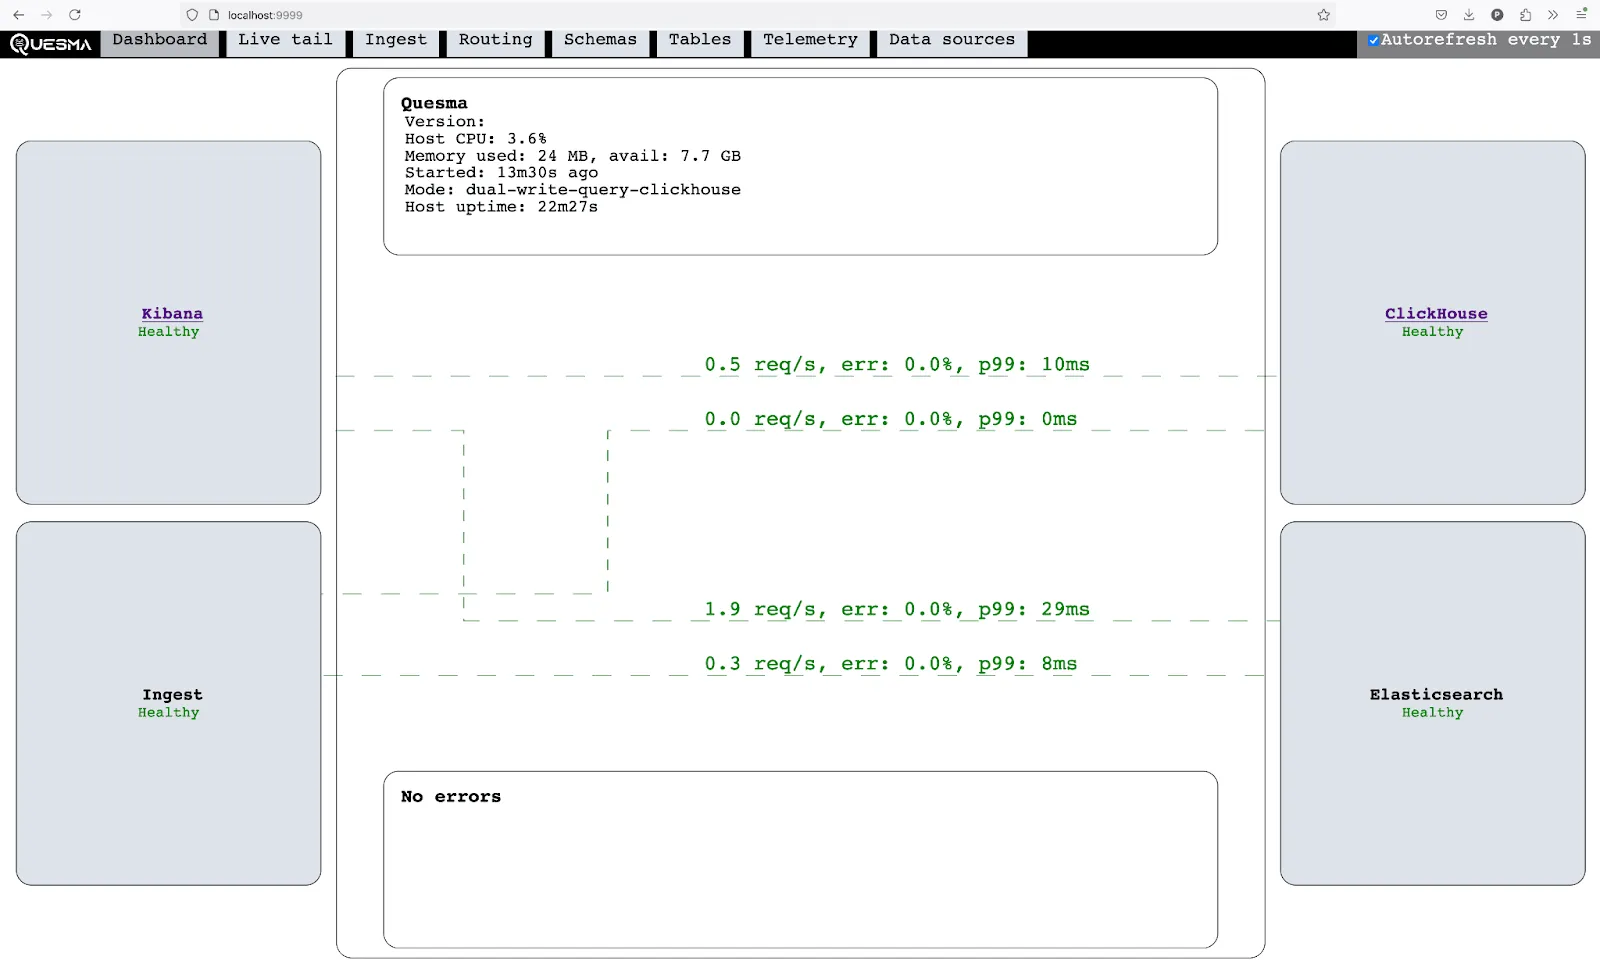
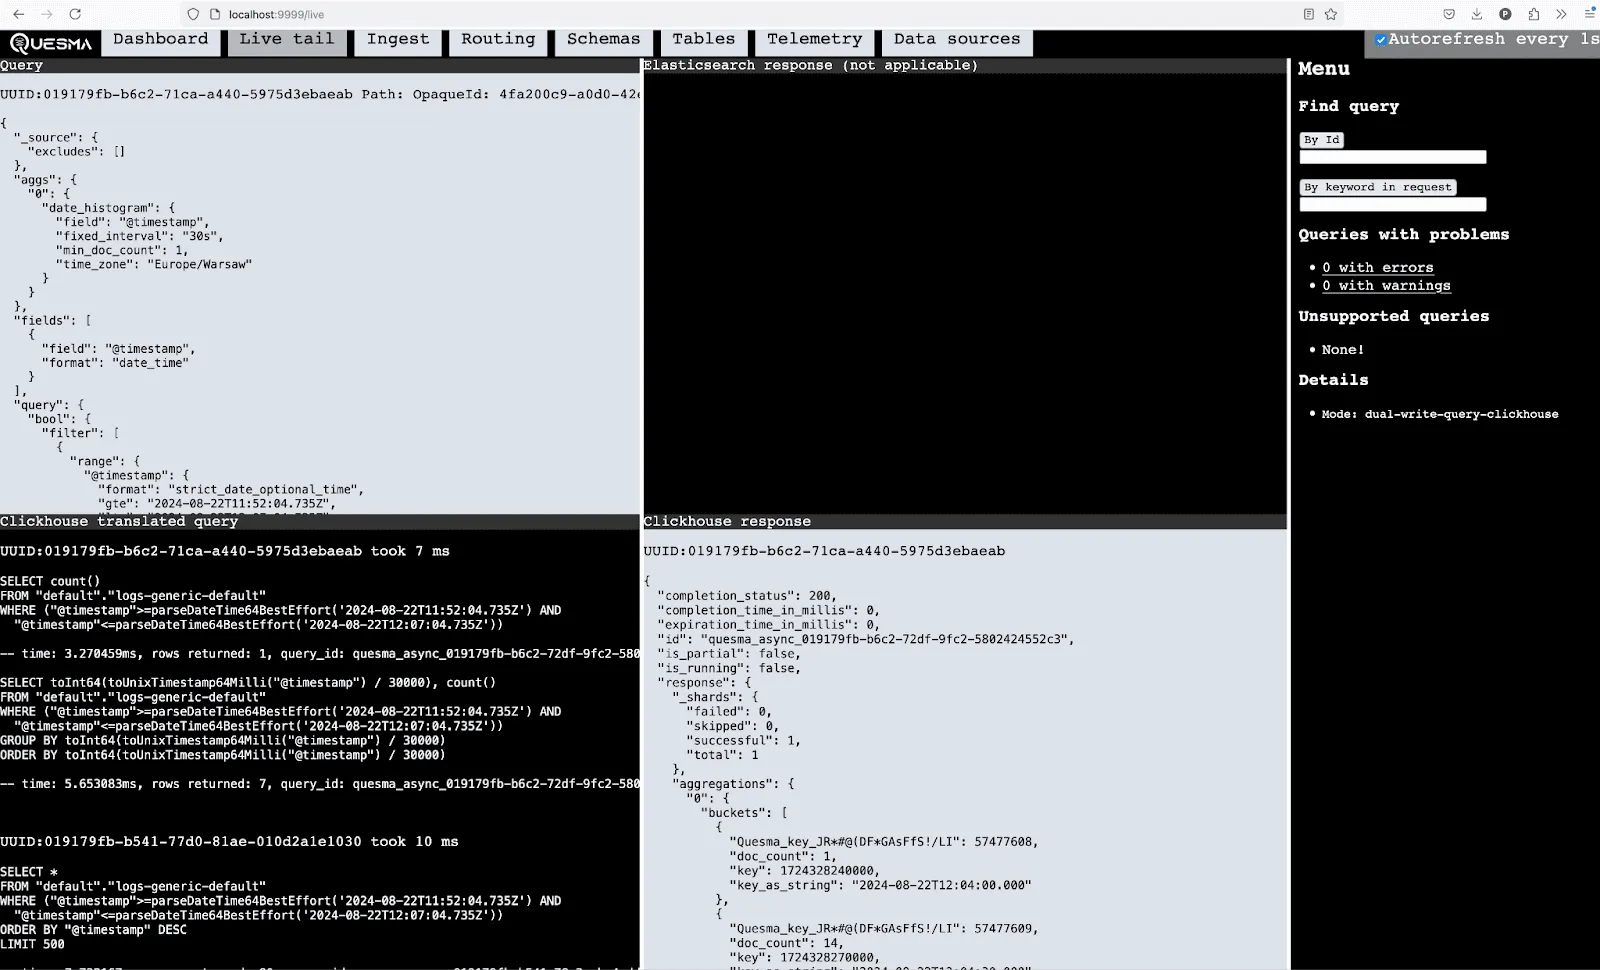
Summary
Pretty neat, right? You can even ingest your own data into ClickHouse and view it in Kibana. If you’re interested in integrating Quesma into your environment, reach out to us — we’re here to help.
Stay tuned for future posts and releases